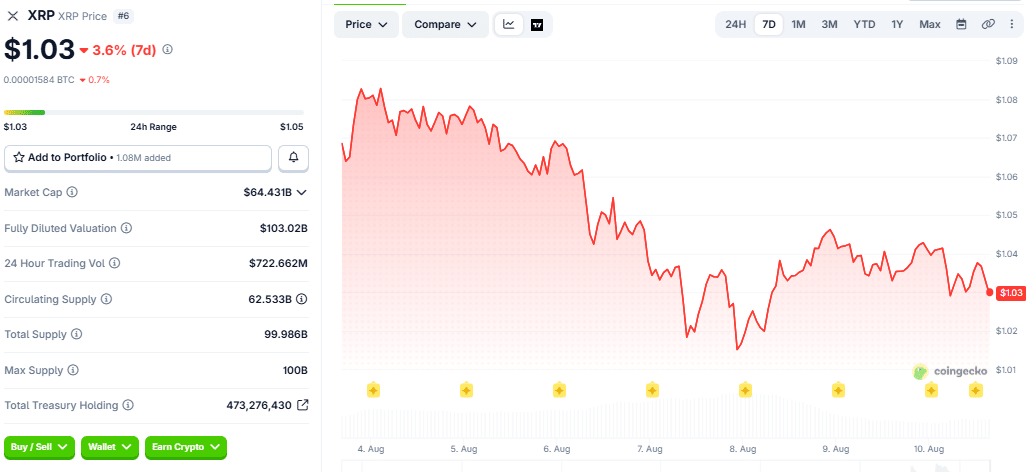
XRP has been left behind in crypto’s early-August bounce. As of roughly 15:40 IST on August 10, XRP traded at about $1.03, down around 3.6% over the past seven days, according to CoinGecko data. Over the same window, Bitcoin rose about 3.8% to roughly $64,988 and Ethereum gained about 4.0% to around $1,917, a divergence of nearly seven percentage points that has made XRP the weakest of the major cryptocurrencies this week.
The gap is notable because it runs against the broader tape: the total crypto market capitalization stood near $2.28 trillion, up about 0.5% on the day. In other words, XRP is not simply moving with the market — it is falling while most of it holds or rises, and it has slipped in the rankings, with BNB overtaking it to leave XRP sixth by market value. Below is a breakdown of what is driving the underperformance, and the counterpoints worth weighing.
The 7-Day Scoreboard
The numbers frame the story. Per CoinGecko, at the time of writing XRP was near $1.03 with a market capitalization of about $64.4 billion and 24-hour trading volume of roughly $723 million. Bitcoin sat at about $64,988 (a market cap near $1.30 trillion) at 15:43 IST and Ethereum at about $1,917 ($231 billion) at 15:43 IST, both up on the week.
Across the top of the market, Bitcoin and Ethereum were green over seven days while XRP was red, and the underperformance widens on longer timeframes, with XRP’s 90-day return running around -24.8%, according to data cited by CoinMarketCap and CoinGecko as of August 10 15:45 IST.
That relative weakness is the crux: macro conditions have been only mildly risk-off, so XRP’s steeper slide points to token-specific pressures rather than a market-wide sell-off.
Reason 1: ETF Inflows Have Collapsed
The clearest driver is a sharp slowdown in institutional demand through spot XRP exchange-traded funds, investment products that let traditional investors gain exposure without holding the token directly. Weekly net inflows into U.S. spot XRP ETFs plunged roughly 93%, to about $1.01 million for the week ending August 8, down from $14.86 million the prior week, according to SoSoValue data. Total XRP ETF net assets slipped to about $964 million, the weakest showing among major crypto ETFs.
The contrast with Bitcoin and Ethereum is stark. Over a comparable period, Bitcoin ETFs pulled in roughly $754 million and Ethereum ETFs around $195 million, as per Farside data, hundreds of millions of dollars flowing into the two largest assets while XRP drew barely a million. That capital rotation is a direct headwind for XRP’s relative performance.
Reason 2: Grayscale Selling and a Leverage Flush
Two additional sources of pressure sharpened the move. Grayscale’s XRP Trust reported net outflows of 103.41 million XRP, worth about $180.78 million, during the first half of 2026, per its SEC filing, adding a steady stream of supply to the market. And in the derivatives market, over the weekend, CoinGlass recorded about $9.48 million in XRP liquidations, with nearly 98% coming from long positions, meaning traders betting on a price rise were forced to sell as XRP fell, briefly amplifying the downside.
Reason 3: The CLARITY Act Delay Removed XRP’s Catalyst
Regulation sits high on analysts’ list of explanations. The CLARITY Act, the crypto market-structure bill many view as key to cementing XRP’s regulatory status and unlocking broader institutional participation, stalled in the Senate over an unresolved ethics dispute and missed its pre-recess window. As The Crypto Times reported, the Senate has since filed a motion to proceed that sets up a possible September vote, but no vote is expected before mid-September at the earliest. For XRP, that delay removes a near-term catalyst at a time when its previous one, a favorable commodity-status ruling earlier in the year, has faded from view.
Reason 4: XRP Keeps Missing the Rotation
Beyond flows and policy, there is a narrative problem. When capital rotates back into crypto, it has tended to chase assets with a fresh story — this year, that has meant tokenization plays associated with Ethereum and Solana. XRP, without a new catalyst since the spring, has repeatedly been passed over in these rallies, a pattern that has made it one of the worst-performing majors of 2026 after sliding from about $3.65 to near $1 over roughly six months. This week’s bounce, led by Bitcoin and Ethereum, fit the same template.
The Other Side: Signs of Accumulation
The bearish case is not the whole picture, and a balanced read has to weigh the counterpoints. On-chain data by Santiment shows that large XRP wallets, those holding between 100 million and 1 billion tokens, increased their share of supply from 10.6% to 11.99%, a sign that some sizable holders have been accumulating at lower prices, while smaller wallets that sold earlier began buying back around August 6.
Combined with the fact that ETF flows have slowed rather than turned sharply negative, that suggests conviction has not entirely drained from the asset.
What to Watch
XRP’s underperformance this week is best understood as a flow-and-catalyst story rather than a macro one. With inflation data and a mildly risk-off backdrop setting a neutral tone for the whole market, it is XRP-specific factors — collapsing ETF inflows, Grayscale’s selling, the CLARITY delay, and a lack of narrative pull — that explain why it fell while Bitcoin and Ethereum rose.
What would change the trajectory is the same thing that has been missing: a catalyst, with movement on the CLARITY Act in September the most obvious candidate. Until then, XRP looks likely to keep trading on its own flows rather than the market’s. Nothing here is a prediction or investment advice.
Also Read: ZEC Price Outperforms Bitcoin 17x in Relative Terms Amid Tightening Supply