
Ethereum is trading at levels that historically signal opportunity, yet the latest on-chain metrics suggest the market has not reached the kind of full capitulation that has marked previous cycle lows.
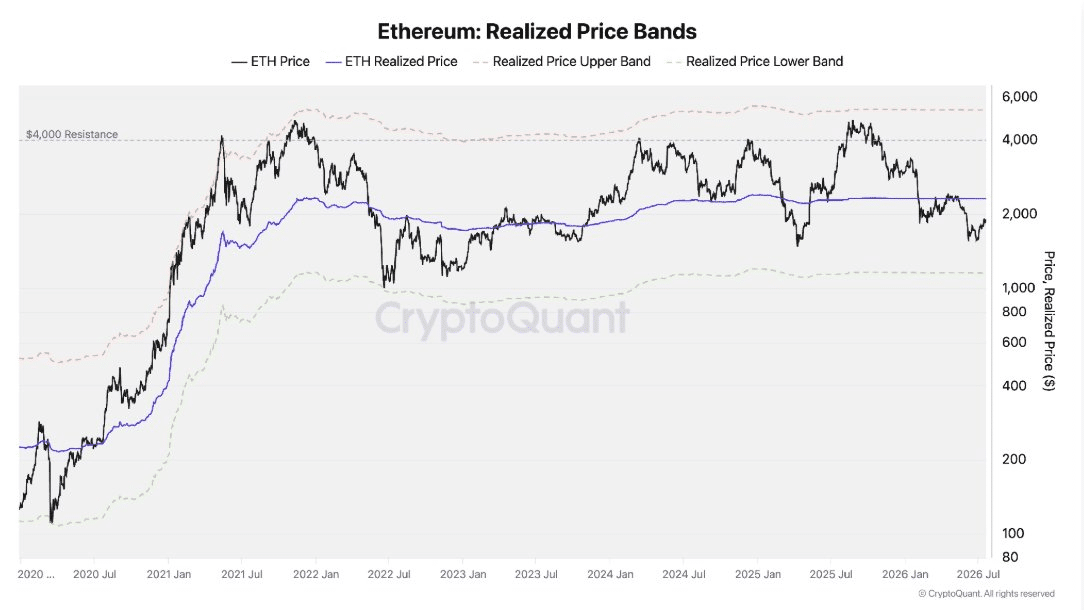
At around $1,900, ETH sits roughly 17% below its realized price of $2,304 and occupies the lower half of its realized price band—a zone that has frequently preceded meaningful upside. Still, a broader set of indicators shows the picture remains incomplete.
The data paints a nuanced portrait: Ethereum is cheaper relative to its cost basis and to Bitcoin than it has been in months, selling pressure is easing, and early signs of institutional interest are reappearing.
At the same time, several key signals have not yet reached the extremes seen at prior bottoms. The result is a market that looks attractive on valuation but has not yet delivered the decisive washout many investors associate with durable turning points.
Valuation Signals Point to Undervaluation Without Full Capitulation
Ethereum’s position relative to its realized price stands out as one of the clearest signs of value. Realized price represents the average cost basis of all coins on the network, calculated from the price at which each unit last moved on-chain.
When the market price falls meaningfully below this level, it often indicates that a large portion of holders are underwater and that further selling may be limited. ETH’s current 17% discount places it firmly in the lower band of historical realized price ranges, an area that has previously coincided with market bottoms and subsequent asymmetric upside.
Relative to Bitcoin, the shift has been even more pronounced. The ETH/BTC MVRV ratio, which measures the market value to realized value of Ethereum against Bitcoin, peaked near 0.95 in August 2025 when ETH was extremely overvalued versus BTC.
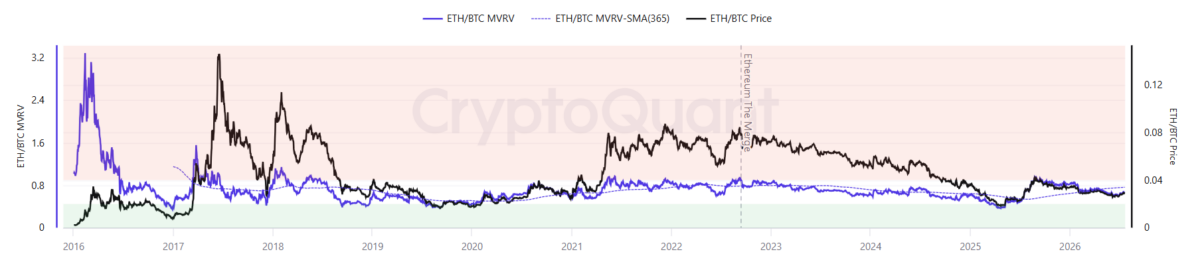
That ratio has since fallen to approximately 0.65. While this represents a move into broadly neutral territory, it remains well above the roughly 0.45 threshold that characterized previous ETH bottoms relative to Bitcoin. In other words, Ethereum has corrected from a period of extreme premium but has not yet reached the deeply discounted levels that accompanied the strongest historical relative recoveries.
These valuation metrics alone would normally generate stronger conviction among on-chain analysts. Yet the absence of deeper capitulation keeps the outlook measured. Markets often require a final wave of forced selling or extreme fear before sustained bottoms form. The current data suggests that wave has not fully arrived.
Easing Pressure and Early Institutional Stirrings Offer Support, but Confirmation Lags
Supporting the more constructive case is a clear reduction in relative selling pressure. The ETH/BTC exchange inflow ratio, which tracks the flow of coins onto exchanges relative to Bitcoin, spiked above 1.5 in August 2025 during a period of heavier Ethereum distribution. It has since declined to roughly 0.8. Lower exchange inflows typically reduce the immediate supply available for sale and therefore cut downside risk.
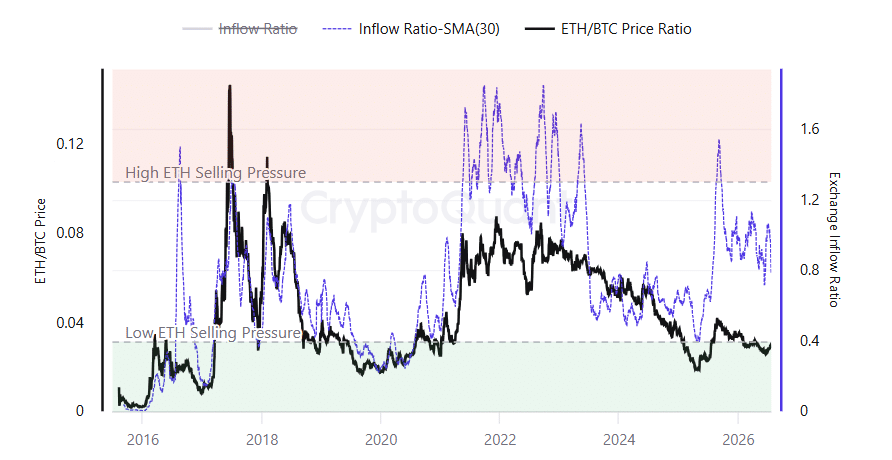
However, the ratio remains short of the approximately 0.4 levels observed during previous low-selling-pressure zones that accompanied major bottoms. Selling has eased, but it has not yet dried up to the degree that would signal exhaustion.
Institutional flows provide another early positive. After declining steadily for most of the past year, the ETH/BTC ETF holdings ratio has shown its first meaningful turn higher. The ratio fell from around 0.20 in August 2025 to approximately 0.115 in June 2026. Since late June it has recovered to about 0.13. While the absolute level remains modest, the directional change marks the first uptick in a year and suggests that at least some institutional allocators are beginning to tilt portfolios back toward Ethereum after a prolonged period of underweighting.
Trading activity already sits at levels historically associated with bottoms. The weekly ETH/BTC spot volume ratio has collapsed from roughly 1.75 to about 0.5. Such compressed relative volume has frequently aligned with ETH/BTC price troughs in past cycles, reflecting reduced speculative interest and a quieter market environment that can set the stage for accumulation.
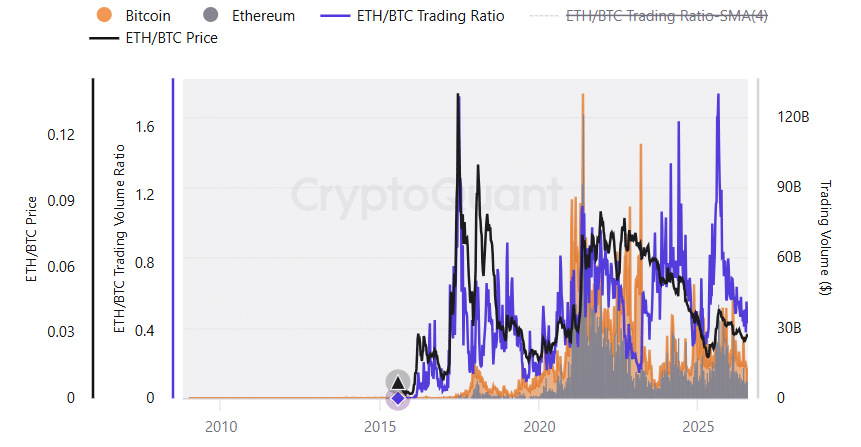
Taken together, two of the five primary signals examined have reached historical bottoming levels, while the remaining three continue to improve but have not yet crossed key thresholds. The combination produces a market that is cheaper and less pressured than it was nine to ten months ago, yet still short of the full suite of confirmations that would declare a definitive bottom.
Technical Analysis
The daily ETH/USD chart shows Ethereum trading near $1,905 after a modest recovery attempt in July 2026. Price action has remained within a broader downtrend channel that began from the early-year highs near $3,400.
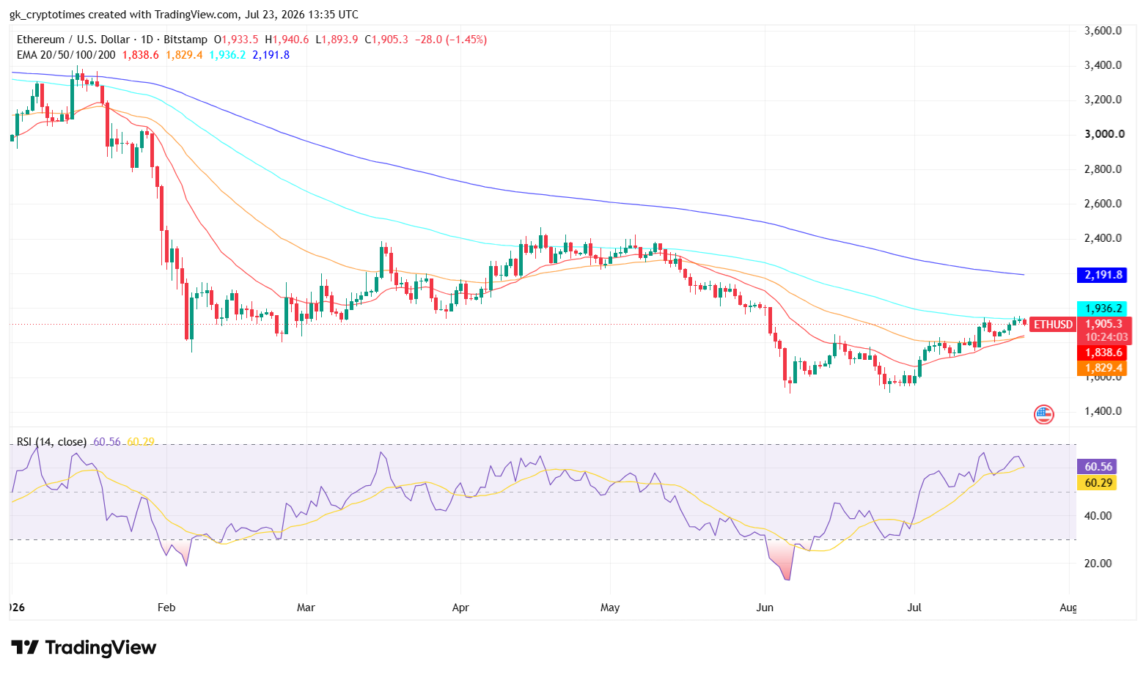
The asset is currently consolidating above its 20-day EMA ($1,838) while sitting well below the 50-day ($1,936) and 200-day ($2,191) EMAs, indicating that the longer-term trend remains bearish. Recent candles have formed higher lows since the June capitulation low near $1,650, suggesting short-term momentum is improving, though resistance at the $1,940–$1,950 zone (recent swing high and 50-day EMA) must be cleared for a more convincing bullish reversal.
The 14-period RSI currently reads 60.56, hovering in neutral-to-bullish territory after climbing from oversold levels in June. This reading leaves room for additional upside before overbought conditions develop. Volume has been subdued during the July bounce, consistent with the on-chain observation of compressed ETH/BTC spot volume.
A decisive daily close above the 50-day EMA would strengthen the case for a retest of $2,100–$2,200, while failure to hold $1,830 support could retest the June lows. Overall, the technical setup aligns with the on-chain view: Ethereum appears undervalued with improving short-term momentum, but remains in a larger corrective phase until it can reclaim key moving averages.
Outlook
For market participants, the practical implication is one of cautious opportunity rather than outright conviction. The 17% discount to realized price and the move into neutral ETH/BTC valuation create a more favorable risk-reward profile than existed in mid-2025. Easing exchange inflows and the first stirrings of ETF reallocation add incremental support. At the same time, the incomplete nature of the signal set means further consolidation or even another leg lower cannot be ruled out.
Historically, Ethereum has delivered its strongest relative returns against Bitcoin once multiple on-chain metrics aligned at extreme levels. The current environment shows meaningful progress toward those extremes without having fully arrived. Investors watching the space will likely focus on whether the ETH/BTC exchange inflow ratio continues lower toward 0.4, whether the MVRV ratio approaches the 0.45 zone, and whether institutional holdings sustain their recent recovery.
Until those additional confirmations appear, Ethereum remains in a zone of relative value rather than one of confirmed capitulation. The data indicates the asset is cheaper, the selling is lighter, and early demand is reemerging—yet the market has not yet delivered the full suite of conditions that have marked previous durable bottoms.
Also read: Circle (CRCL) Falls 7% as CLARITY Democrats Balk, Erasing Its 20% Rally