
In the span of just over two years, Bitcoin’s on-chain cost structure has undergone one of the most significant transformations in its history. What began as a network overwhelmingly dominated by low-basis coins from earlier market cycles has evolved into one where nearly half the supply last moved at prices above $63,100.
This shift, highlighted in recent on-chain analysis, underscores how institutional participation through spot exchange-traded funds has fundamentally altered the asset’s liquidity and holder dynamics.
More than simple price appreciation, the move represents a broad repricing of Bitcoin’s ledger as dormant supply interacted with new demand channels. Thirty months after the launch of major Bitcoin ETFs, the data paints a picture of a maturing market where ancient coins have been activated, high-cost inventory has been redistributed, and the cheap-basis foundation that once characterized much of the network has been permanently altered.
Understanding Realized Price Metrics
Realized price refers to the price at which each unit of Bitcoin (tracked via unspent transaction outputs, or UTXOs) was last moved on the blockchain. Unlike the spot market price, which fluctuates in real time, realized price captures the historical cost basis embedded in the supply. The total supply is divided into bands based on these last-movement prices to reveal patterns in holder behavior, profit-taking, and accumulation.
As of mid-July 2026, Bitcoin’s aggregate realized price stands at approximately $52,400, with long-term holders averaging around $49,900 and short-term holders near $68,000, while the spot price trades around $64,500—highlighting the elevated positioning of recent on-chain activity relative to the broader ledger average.
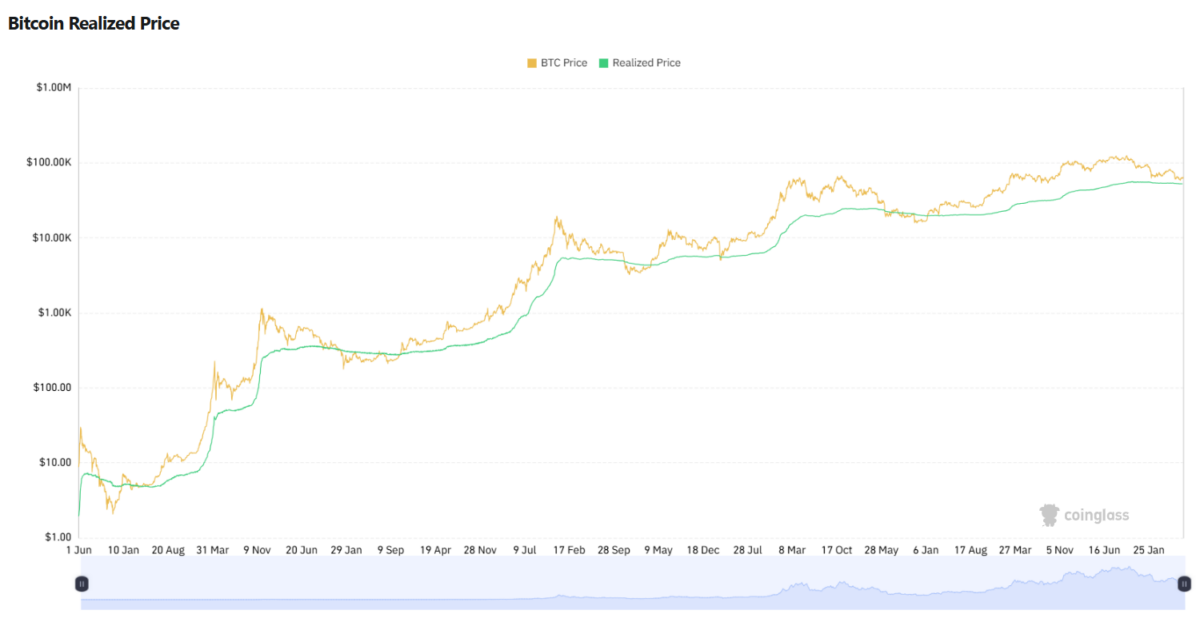
This metric provides insight into conviction levels. Coins with low realized prices often belong to long-term holders who acquired Bitcoin cheaply in prior cycles. When these coins move at much higher prices, it signals distribution or profit realization. Conversely, sustained movement into higher bands indicates strong demand absorbing supply at elevated levels.
In Bitcoin’s case, the distribution across these bands has historically been skewed toward lower realized prices due to the asset’s early-adopter base and periods of illiquidity. The introduction of regulated, accessible investment vehicles changed that dynamic by creating consistent buying pressure from large-scale participants.
The Landscape at ETF Inception
When BlackRock’s iShares Bitcoin Trust (IBIT) began trading in early January 2024, the on-chain picture looked markedly different. At that time, roughly 99.58% of Bitcoin’s supply carried a realized price below $63,100. Only a tiny fraction—about 0.42%—sat in higher bands. The vast majority of coins reflected cost bases from the pre-2021 era or earlier, many well under $40,000.
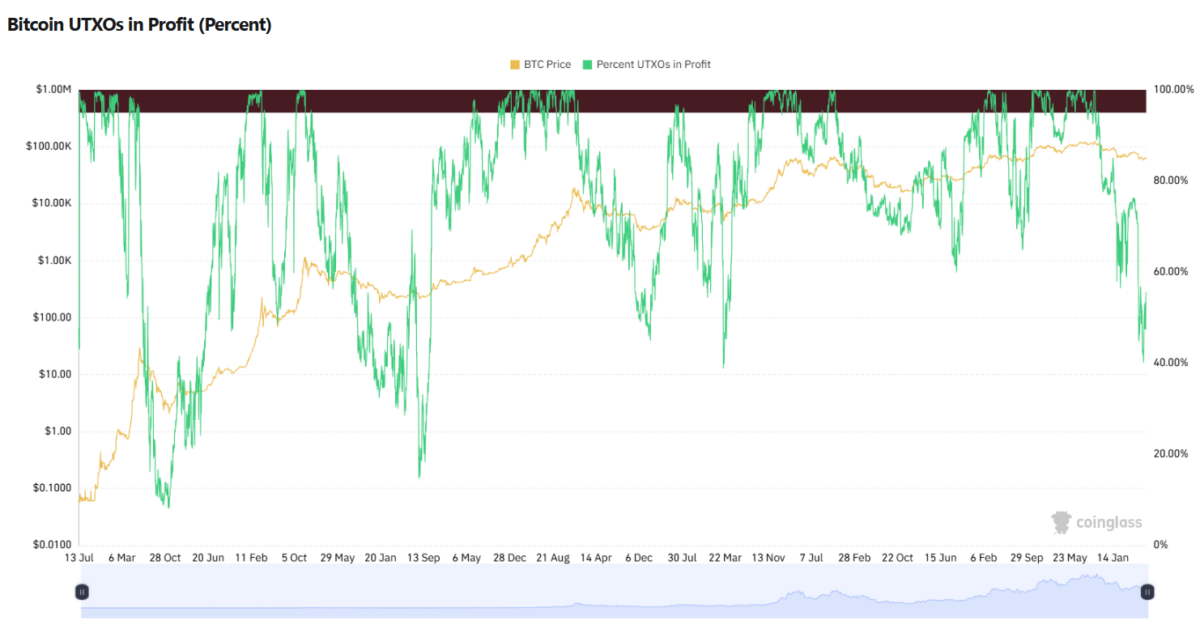
This “cheap-basis network” meant that a large portion of supply could theoretically withstand significant drawdowns before holders faced losses on paper. It also implied limited recent on-chain activity for much of the circulating supply, consistent with a market still transitioning from retail-driven cycles to broader participation.
The post-launch environment quickly introduced new forces. Spot ETFs required issuers to acquire actual Bitcoin to back their shares, establishing a direct pipeline between traditional capital markets and the blockchain. This created ongoing demand that interacted with existing holders, prompting movement that reset realized prices upward for millions of coins.
Evolution Through the Market Cycle
By mid-2026, the distribution had shifted dramatically. Data shows that 50.50% of the supply—approximately 9.73 million BTC—now carries a realized price above $63,100. This equates to a net repricing of roughly 9.65 million BTC since the ETF era began.
The trajectory included a notable peak in late 2025 when Bitcoin reached six-figure territory. During that phase, substantial supply moved into the highest realized bands. However, the subsequent drawdown triggered redistribution. The band above $100,000 contracted by approximately 3.18 million BTC, while the $63,100 to $100,000 band expanded by about 3.95 million BTC.
This “recycling” of high-cost inventory one level lower illustrates how profit-taking and strategic repositioning occurred without fully resetting to pre-ETF levels. The cheap-basis dominance that defined the network at the start of the period did not return. Instead, a more balanced and elevated cost structure emerged, with nearly half the supply now anchored at prices well above the levels seen in early 2024.
Visual representations of these shifts, such as stacked bar charts breaking down supply by realized-price regions, make the transformation strikingly clear. They show a clear progression: from heavy concentration in lower bands at inception, through expansion into higher bands at the cycle peak, to the current more distributed profile.
The Catalyst: Spot Bitcoin ETFs and Institutional Flows
The primary driver behind this repricing has been the influx of institutional capital via spot Bitcoin ETFs. These products provided a familiar, regulated wrapper for exposure to Bitcoin, attracting assets from wealth managers, advisors, and larger funds that previously faced barriers to direct crypto ownership.
Issuers like BlackRock accumulated Bitcoin holdings at scale to support share creation, injecting consistent spot demand into the market. This activity coincided with periods of both inflows and temporary outflows, yet the net effect over thirty months was substantial absorption of supply. Dormant coins held by early participants found new liquidity channels, moving on-chain at prevailing market prices and establishing higher realized bases.
The result was an “industrial loading dock” for Bitcoin supply, as one analyst described it. Previously illiquid or long-held coins entered circulation more readily, interacting with professional trading desks and portfolio rebalancing. This process accelerated the transition from a market characterized by ancient, low-cost outputs to one where recent movements reflect institutional-era pricing.
As of July 16, 2026, the total assets under management (AUM) across all U.S. spot Bitcoin ETFs sits at approximately $78.47 billion, with the funds collectively holding over 1.21 million BTC. BlackRock’s IBIT remained the dominant player with roughly $47.6 billion in net assets as of July 15, representing the largest share of the overall complex.
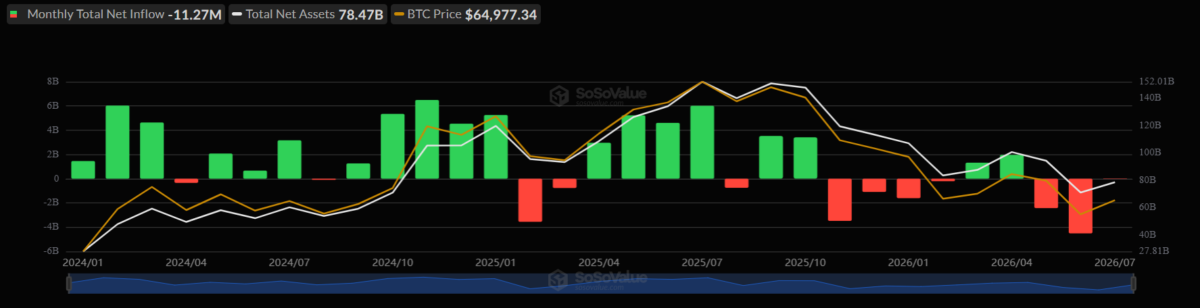
Broader market data from 2026 shows Bitcoin trading near $64,500 range amid ongoing volatility, with ETF flows remaining a key sentiment indicator. Periods of strength often aligned with renewed institutional interest, reinforcing the on-chain shifts observed in the realized price bands.
Implications for Holders and Market Dynamics
This repricing carries several implications for Bitcoin’s market structure. A higher average realized price across a large portion of supply can signal greater holder resilience during future corrections, as fewer coins sit deeply underwater. It may also reduce the overhang of “cheap” supply that historically fueled sharp rallies once new demand emerged.
At the same time, the redistribution during drawdowns highlights how profit-taking at elevated levels can create temporary supply pressure before settling into new bands. The net upward movement in realized prices suggests that the ETF-driven demand has been sufficient to absorb coins without allowing the cost basis to collapse back to pre-2024 levels.
For long-term observers, the data reinforces Bitcoin’s evolution as an institutional asset class. The network no longer operates in isolation from traditional finance; instead, it incorporates capital flows that reshape its internal economics. This integration brings both opportunities—such as improved liquidity and price discovery—and new dynamics around flow sensitivity and holder behavior.
Looking Ahead
As Bitcoin continues to mature, the rewritten realized price map serves as a benchmark for future cycles. Sustained institutional participation could further elevate cost bases, while any significant contraction in demand might test the durability of the current distribution.
The transformation observed since early 2024 demonstrates the power of accessible investment vehicles to influence on-chain realities. What was once a market dominated by early, low-basis holdings has become one where a substantial share of supply reflects the pricing environment of the ETF era.
This shift is not merely statistical—it reflects a deeper integration of Bitcoin into global capital markets, with lasting effects on how supply and demand interact on the blockchain. As more data accumulates, analysts will continue monitoring these bands for signals about conviction, distribution, and the asset’s structural resilience in the years ahead.
Also read: Research Accuses Binance Users of Bitcoin Manipulation for Polymarket Gains