Key Highlights
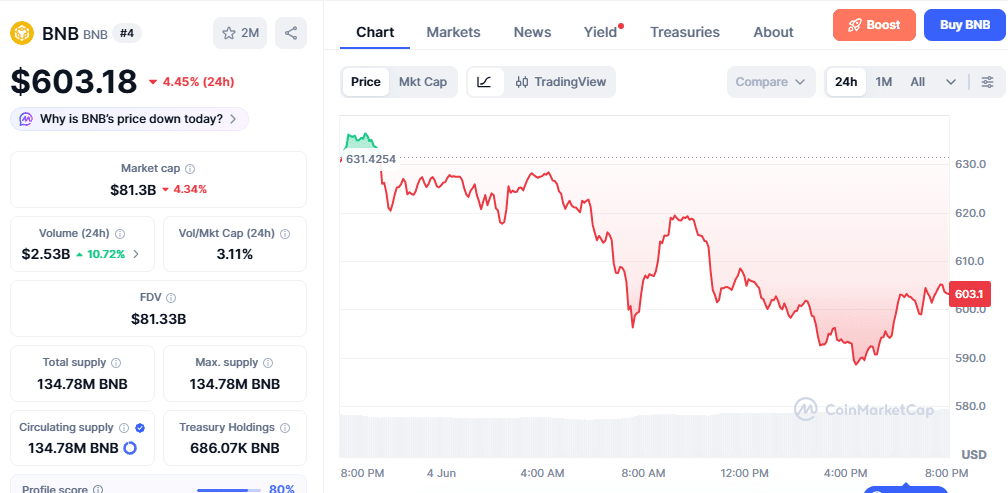
- BNB dropped 4.38% in 24 hours, trading around $602 after facing resistance near $637.
- Trading volume rose 8.5% to $2.52 billion, signaling heightened market activity amid the decline.
- Most major moving averages and momentum indicators are flashing bearish signals.
BNB, the native token of the BNB Chain, declined about 4.38% over the past 24 hours, trading around $602.62 as of today. The token briefly tested higher levels near $637 but found strong selling pressure, ultimately closing the session near the lower end of its daily range. This marks a continuation of short-term weakness, with the asset also showing a roughly 4.2% decline over the past week.
At the time of writing, BNB has a market capitalization of $81.22 billion, reflecting the same 4.38% daily drop, according to CoinMarketCap. The 24-hour trading volume reached $2.52 billion, representing an 8.51% increase, which suggests heightened market participation even amid the price decline. This elevated volume relative to market cap indicates active trading interest, potentially from profit-taking or risk-off sentiment across the broader crypto market.
BNB leans toward sell territory
The technical picture for BNB paints a predominantly bearish outlook in the short term. On the 1-day timeframe, both oscillators are neutral; however, moving averages lean heavily toward “strong sell” territory.
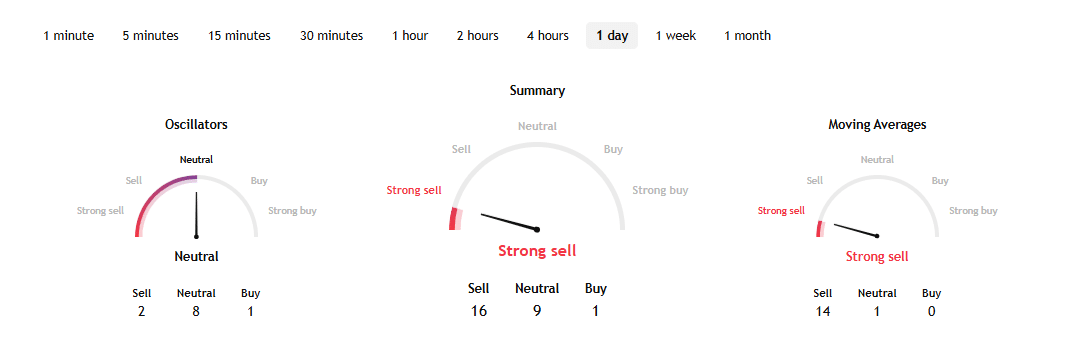
Simple Moving Averages as well as Exponential Moving Averages across multiple periods (10, 20, 30, 50, 100, and 200) are flashing sell signals, with values ranging from approximately $635 to $729, all positioned well above the current price. This suggests BNB is trading below its key averages, confirming downward momentum.
The Relative Strength Index (RSI at 14) sits at 37.67 (Neutral), while the MACD and Momentum indicators are registering sell signals. The Williams %R is one of the few bullish outliers at a “Buy” level, but it is outweighed by the broader consensus.
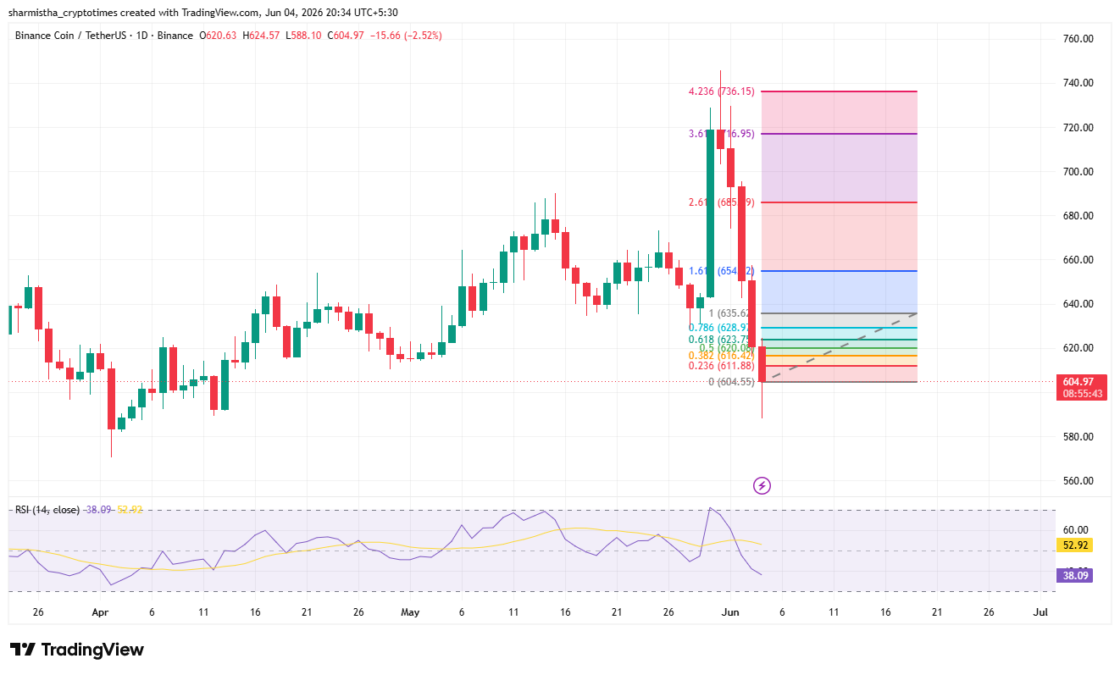
The price is currently hovering near the lower support zone after failing to sustain above $630. A 1-day Fibonacci scale reveals that a decisive break below $588 (recent 24h low) could open the door toward deeper support near $557, while a recovery above $637 might signal short-term relief toward $740.
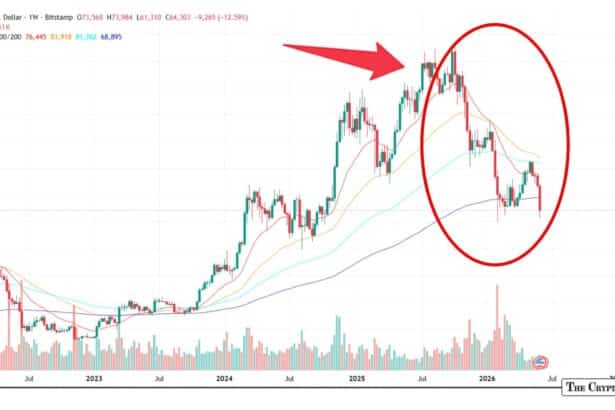
The weekly chart illustrates a clear pattern: BNB enjoyed a strong rally in late May, peaking near $700 before entering a corrective phase. The recent descent has erased much of those gains, with the price now sitting in the lower portion of the recent trading range. The all-time high of $1,370.55 recorded on October 13, 2025, remains distant, with BNB down over 55% from that peak.
BNB liquidations and ETF data
A key driver behind the accelerated move lower has been significant leveraged liquidations across major exchanges. In just the past 4 hours, total exchange liquidations reached $142.57 million, according to CoinGlass data. Notably, long liquidations amount to $60.67 million, whereas short liquidations are $81.89 million (57.44% of total). On Binance alone, liquidations totaled $49.36 million, with shorts accounting for $28.12 million.
The newly launched US BNB Spot ETF recorded modest activity with $1.21 million in total net inflows on a single day, matching its cumulative net inflow. Daily transaction volume stood at $71.61K, while total net assets reached $2.19 million, according to Sosovalue data.
Token faces high volatility
BNB’s utility within the Binance ecosystem, including fee discounts, staking, and launchpad participation, continues to support its fundamental value. However, the token remains sensitive to broader market sentiment, regulatory developments around Binance, and overall risk appetite in digital assets.
Traders should watch for a potential bounce from the $588–$600 zone. Sustained volume and positive divergence on the RSI could facilitate a recovery attempt toward $637–$650. Failure to hold $588 would likely accelerate selling toward the next major support.
High volatility remains a key factor. Elevated 24-hour volume could either fuel a sharp reversal or amplify downside if selling accelerates.
The alignment of multiple moving averages as resistance suggests any rally may face significant selling pressure. A weekly close above $650 would be needed to neutralize the current bearish structure.
Also Read: Arthur Hayes Dumps Entire HYPE and NEAR Stack Days After $100K Charity Bet