Key Highlights
- XRP has entered a rare oversold RSI zone seen only four times in 13 years, and each past case came before a major price rebound.
- The price remains under pressure, down over 31% this year, with short-term weakness continuing around the $1.26 support level.
- The chart is split between a possible “bear trap” recovery if key levels are reclaimed or a deeper drop toward $0.90 or $0.70 if support fails.
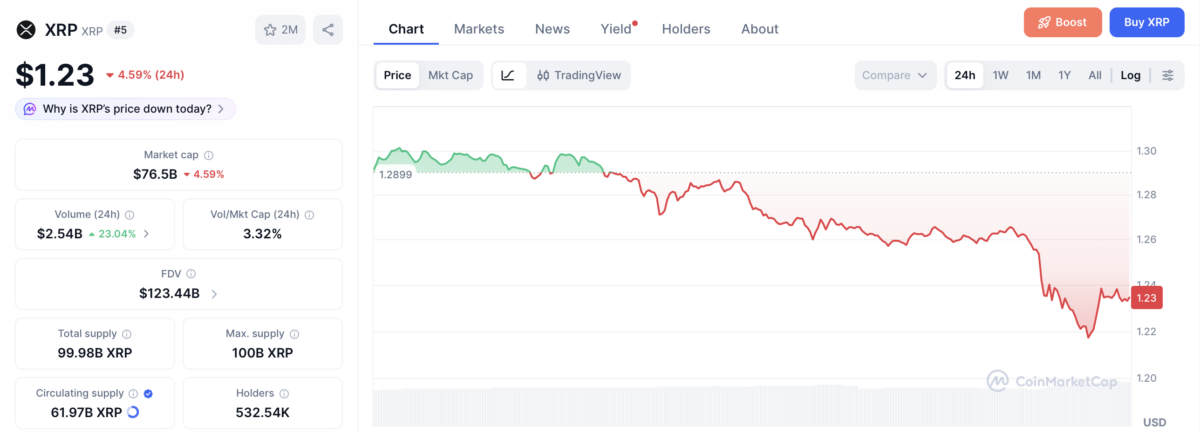
XRP, the native token of Ripple, is under selling pressure after falling into a rare oversold level. At the time of writing, the token is trading for $1.26 as the wider crypto market faces a major downturn.
This decline is about 5% in the last 24 hours from an intraday high of $1.30. The drop also extends to the weekly fall, which has now reached negative 7.9%. Meanwhile, trading activity is up by 23%, suggesting that traders are actively selling the token as the volume reaches $2.5 billion.
Rare RSI signal appears again
Technical indicators show that this selling pressure has pushed XRP into a level that has only appeared a few times in its long history. The monthly Relative Strength Index (RSI), a tool used to measure if an asset is overbought or oversold, has now dropped below 29.
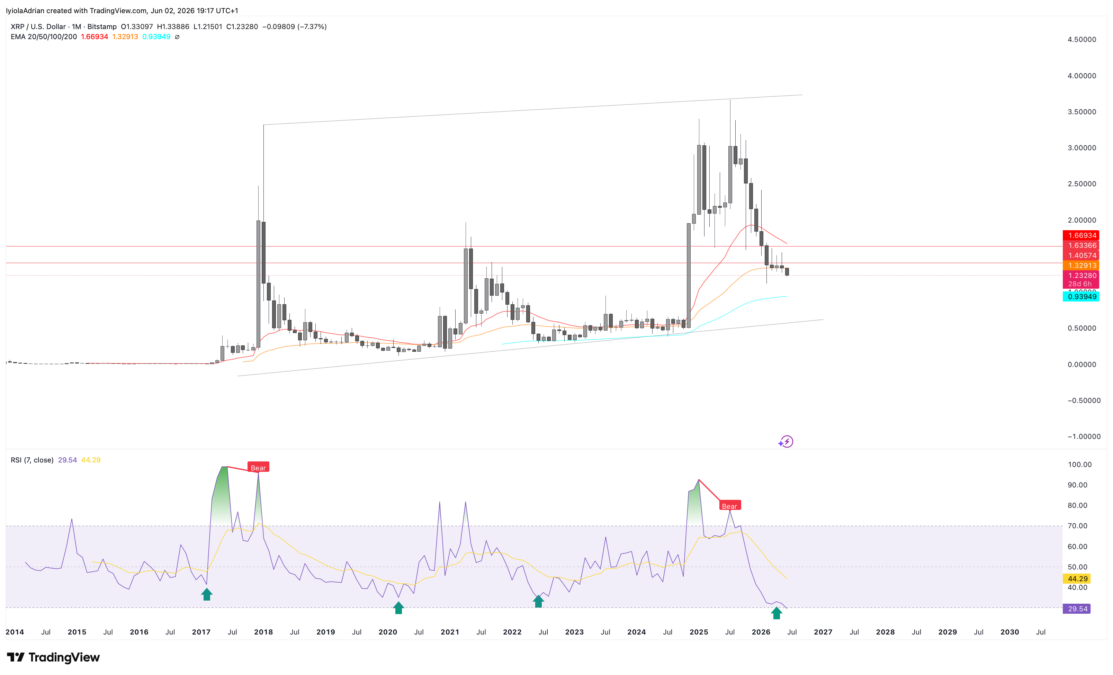
This is a level that is considered rare for XRP. In fact, looking at past data, XRP has only entered this same zone four times in about 13 years.
These moments happened in January 2017, March 2020, June 2022, and now again in 2026. Each of those times came during heavy market stress when prices were falling and fear was high.
Past cycles show strong recovery after similar levels
What makes things interesting is what happened after this past moment. In 2017, XRP later exploded to a huge high in the next cycle. After the 2020 drop, it recovered strongly and climbed back up in the following bull run.
The same kind of pattern also followed the 2022 low, where the price later bounced again over time. Because of this history, it is believed that XRP might be sitting at another turning point.
Crypto analyst Cryptollica highlighted the pattern in an X post, stating, “The previous three were not normal pullbacks. They appeared near major cycle reset zones…. Four oversold monthly resets in 13 years. The first three mattered. Now the fourth one is here.“
Weak short-term trend continues
But while this long-term pattern might be promising, the current price action is still weak in the short term. XRP is down more than 31% this year. Earlier in May, it tried to recover and moved up to around $1.55, but that strength did not last. The price slipped again to $1.36 and then dropped further to $1.26. In short, sellers are active in this market, and buyers have not fully taken control yet.
At the same time, XRP is now trading very close to key long-term indicators, including the 50-month moving average and a major upward trend line that has been in place since 2017.
In past cycles, whenever XRP came close to these levels, the price often slowed down and sometimes formed a base before moving higher again. This is believed to be a possible “bear trap,” meaning the price could dip lower first before bouncing back up quickly.
Key support zone at $1.26 under pressure
If XRP fails to hold the current support area between $1.26 and $1.30, the price could fall further. In that case, possible next targets could be around $0.90 and, in a deeper sell-off, even near $0.70. This level lines up with past market structures where XRP found strong demand.
While this short-term pattern could play out, the long-term picture still has a pattern that traders cannot ignore. Every time XRP entered this rare oversold zone in the past, it later recovered strongly, even if it took time. That is why the current moment feels tense, as the market waits to see if history will repeat or if this time will be different.
Also Read: Ethereum Price Falls 13% This Week as Breakdown Puts $1,600 in Focus