
Ethereum price has dropped nearly 13% over the past week, turning a slow consolidation into a clear downside breakdown. ETH was trading near $1,924 on Binance at the time of the chart, down more than 4% on the day, after losing the lower trendline of its multi-week daily structure.
The move has pushed Ethereum below its 20-day, 50-day, 100-day, and 200-day EMAs, weakening the short-term recovery case. With the $1,925 support area now broken, traders are watching whether ETH can reclaim $2,000 or extend losses toward the next major demand zone near $1,550–$1,600.
ETH Breaks Down From Consolidation Pattern
The most important technical development is the breakdown from the multi-week consolidation structure visible on the daily chart. ETH had been moving inside a slightly rising channel since February, with buyers defending the lower boundary multiple times.
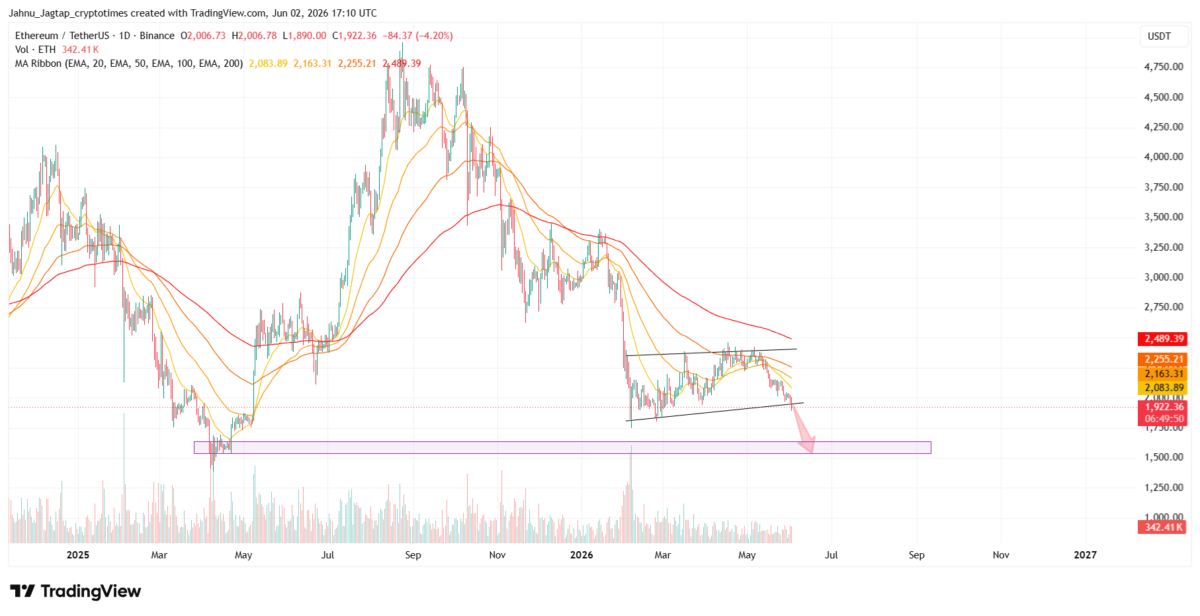
That support has now failed.
The break below the lower trendline weakens the short-term recovery structure and opens the door for a deeper correction. The chart points toward the next major demand area between $1,550 and $1,600, marked by the previous accumulation zone from April 2025 and the February 2026 low region.
This zone is now the key downside target for bears if ETH fails to reclaim the broken support quickly.
Moving Averages Show Heavy Resistance Above $2,000
Ethereum is also trading below all major daily exponential moving averages, which adds pressure to the bearish setup.
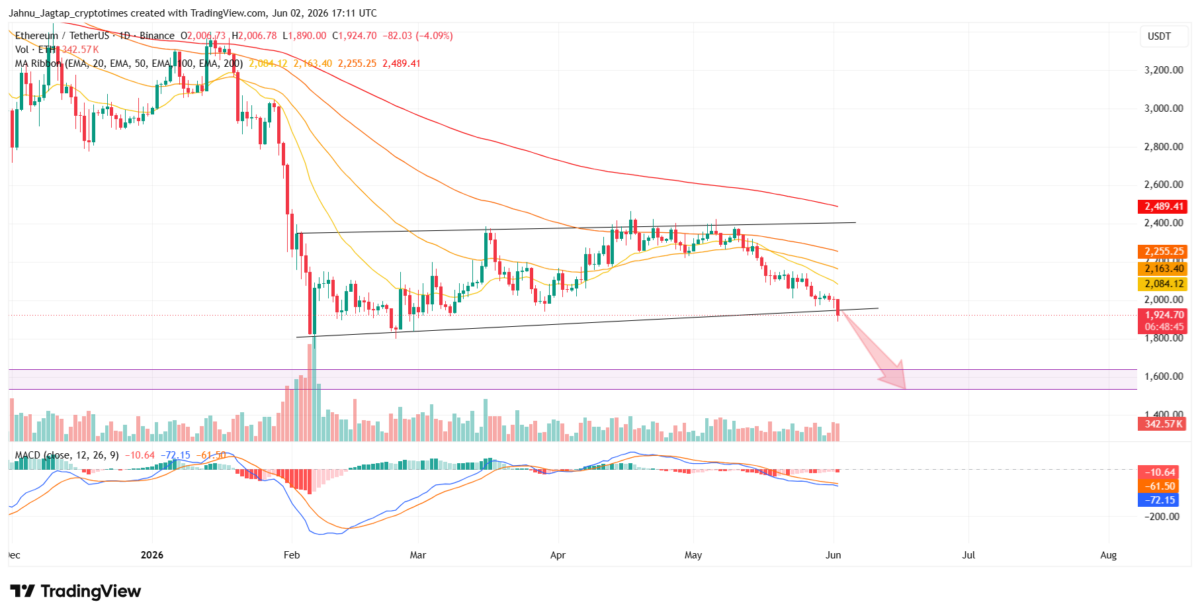
The 20-day EMA is near $2,084, the 50-day EMA is around $2,163, the 100-day EMA sits near $2,255, and the 200-day EMA remains much higher near $2,489.
This means ETH faces multiple resistance layers even if it attempts a short-term bounce. The first important level to reclaim is $2,000, followed by the 20-day EMA near $2,084. A stronger recovery would need ETH to move back above $2,160–$2,255 to neutralize the current bearish structure.
Until then, rallies may continue to face selling pressure.
MACD Confirms Bearish Momentum
The MACD also supports the bearish view. The MACD line remains below the signal line, while the histogram is still negative. This shows that downward momentum has not yet faded.
The indicator had already started weakening in May, and the latest price breakdown confirms that sellers are still in control. Unless the MACD starts flattening or forms a bullish crossover, ETH may remain vulnerable to further downside.
ETH Price Levels To Watch
| Immediate resistance: | $2000 |
| 20-day EMA resistance: | $2,084 |
| 50-day EMA resistance: | $2,163 |
| 100-day EMA resistance: | $2,255 |
| Major resistance: | $2,400–$2,489 |
| Immediate support: | $1,890 |
| Next major support: | $1,550–$1,600 |
| Breakdown risk zone: | Below $1,550 |
A daily close back above $2,000 would reduce immediate downside pressure. However, ETH needs to reclaim at least the $2,084–$2,163 range to suggest that the breakdown was a false move.
On the downside, failure to recover above $1,925 could keep the price exposed to a move toward the $1,600 support zone.
What’s Next for Ethereum Price?
Ethereum’s near-term outlook has turned bearish after the daily support breakdown. The price is now below key moving averages, momentum indicators are weak, and the chart structure points toward lower levels unless buyers step in quickly.
For now, $2,000 is the first level bulls must reclaim. If ETH remains below that level, the market may continue to price in a move toward $1,600, where a stronger reaction from buyers could decide whether Ethereum stabilizes or extends its broader downtrend.
Also Read: Bitmine Pulls Back on Ethereum Purchases With 5.42M ETH Held