
Key Highlights
- Bitcoin fell to around $67,800, down roughly 5% on the day, extending its pullback from the May recovery zone.
- The daily chart shows BTC losing the $69,800–$68,000 support band, shifting attention toward $64,100.
- A deeper breakdown below $64K could open the next major downside area near $59,700.
Bitcoin price slipped sharply on Tuesday, falling more than 5% to trade near $67,800 as sellers regained control of the daily chart. BTC is now testing one of its most important short-term areas after losing momentum near the $76,000–$80,000 range.
The move has pushed Bitcoin below the support zone around $69,800–$68,000, a level that had acted as a short-term base during the previous consolidation. The latest daily candle now shows clear downside pressure, with BTC trading close to the lower end of the session.
BTC Breaks Below Short-Term Support
The chart shows Bitcoin failing to hold above its recent rising structure after rejection near the $76,800 zone. That rejection has now turned into a deeper correction, with BTC sliding below the moving-average ribbon and losing the horizontal support area near $69,800.
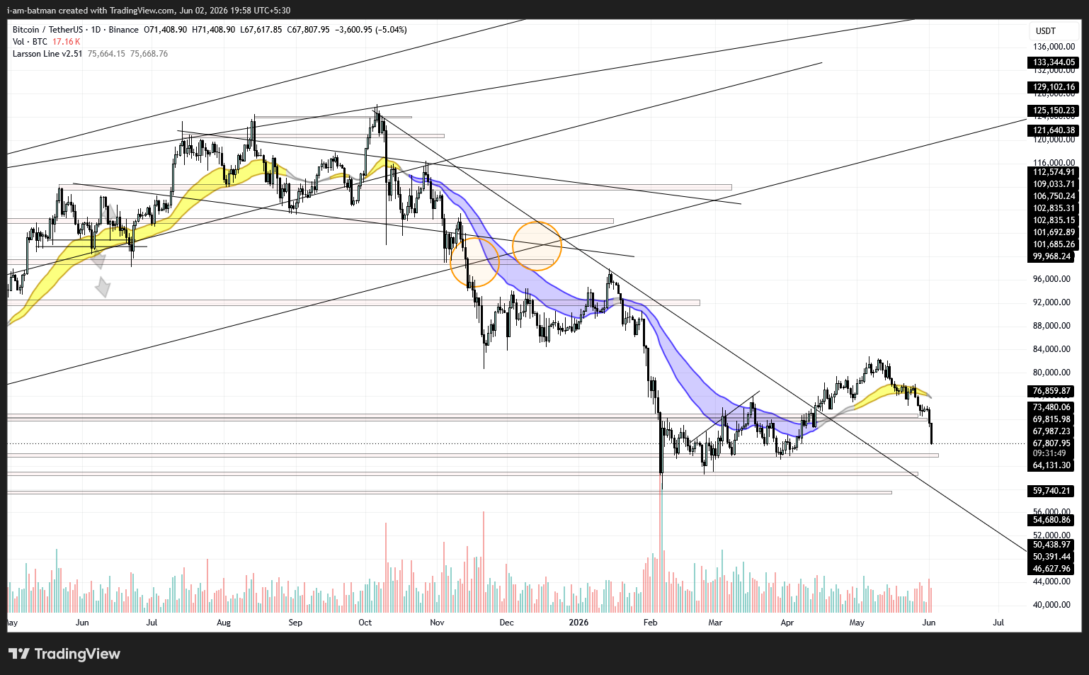
This makes $67,000–$68,000 the immediate battleground. If buyers reclaim this zone quickly, BTC could attempt a recovery toward $69,800 and then $73,400. However, if the price stays below this area, the breakdown may confirm a bearish continuation.
The chart also shows Bitcoin trading below the Larsson Line, which is currently positioned near $75,660. With BTC near $67,800, the price is trading roughly 10% below the Larsson Line, showing that the short-term trend remains under pressure.
The Larsson Line had already started bending lower after Bitcoin failed near the $76,000–$80,000 area. As long as BTC stays below this line, rebounds may face resistance instead of confirming a clean trend reversal.
For bulls, reclaiming the $73,400–$75,600 zone becomes important because it would bring BTC back toward the Larsson Line. Until then, the indicator supports a cautious outlook, with $64,100 and $59,700 remaining the key downside levels to watch.
$64K Becomes the Next Key Level
The next major support on the chart sits near $64,100. This level is important because it marks the lower part of the recent consolidation range. A clean daily close below it would weaken the market structure further and could expose Bitcoin to the next support near $59,700.
Below that, the chart shows deeper downside levels around $54,600 and $50,400, but those remain secondary unless BTC loses the $64K area with strong volume.
Upside Levels to Watch
For bulls, the first task is simple: Bitcoin needs to recover above $69,800. A move back above this level would reduce immediate downside pressure and bring $73,400 back into focus.
A stronger bullish reversal would require BTC to reclaim the $76,800 area, where the latest rejection began. Until that happens, the chart remains tilted toward caution.
Bitcoin Price Outlook
Bitcoin’s near-term trend has turned defensive after the latest 5% fall. The price action suggests that traders are now watching whether BTC can defend the $64K support zone or whether the current pullback turns into a deeper correction toward $59,700.
For now, the market structure remains weak below $69,800, and any rebound that fails near this zone could attract fresh selling pressure.
Also Read: Strive Spends $185M on Bitcoin in 10 Days, Total Holdings Hit 19,000 BTC