
Key Highlights
- Bitcoin is trading at $74,949 (+1.55%) after breaking a 5-month descending trendline, Ethereum climbed to $2,296 (+1.47%), and XRP reclaimed $1.41 (+1.33%).
- US spot Bitcoin ETFs absorbed $663.91 million in net inflows on April 17, with cumulative inflows now at $57.74 billion and total net assets representing 6.55% of Bitcoin’s market cap.
- CryptoQuant analyst Crypto Onchain flagged Ethereum’s 50-day SMA of the Taker Buy/Sell Ratio on Binance hitting 1.018, the highest reading since the last major trend reversal.
The cryptocurrency market shifted tone decisively this week as Bitcoin, Ethereum, and XRP simultaneously broke out of the descending trendlines that had capped every rally since the late-2025 top, a rare case of all three majors aligning on the same structural signal.
The move coincides with a sharp acceleration in institutional flows, with Bitcoin spot ETFs posting their strongest single-day inflow in weeks and Open Interest in Bitcoin futures climbing roughly 10% over the past 30 days, pointing to fresh position accumulation rather than short-covering.
BTC reclaims $74K as trendline breaks and ETF inflows surge
Bitcoin is trading at approximately $74,949 at the time of writing, up 1.55% on the day, after decisively breaking the descending trendline drawn from the November 2025 high near $100,000. Price has reclaimed the 50-day EMA ($71,907) and is now pressing directly into the 100-day EMA ($75,278), the single most important resistance on the daily chart.
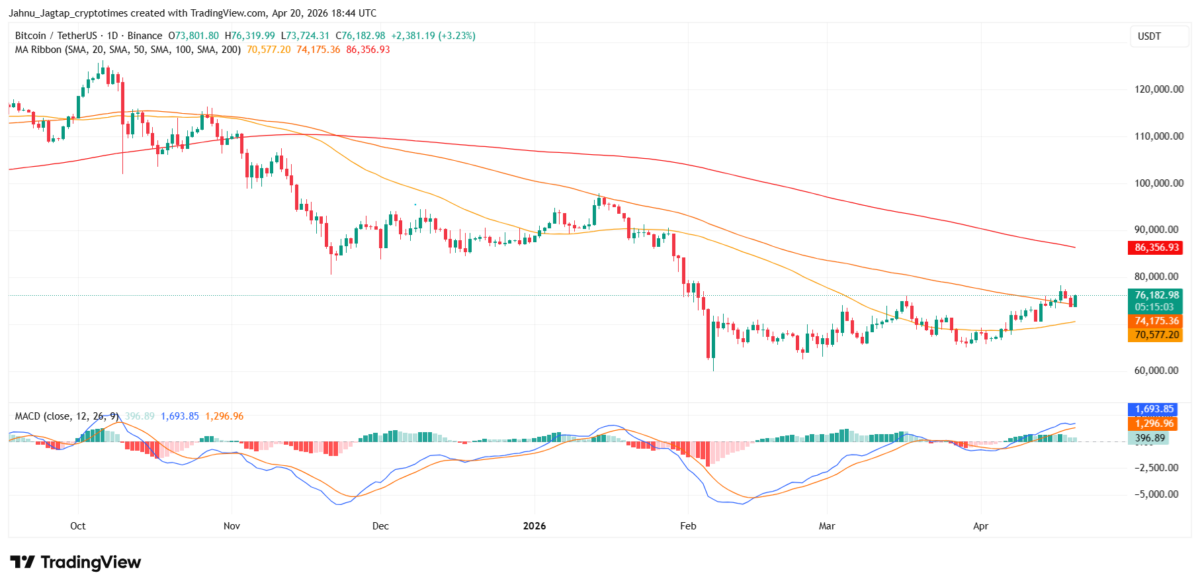
The MACD has confirmed a bullish crossover with the histogram expanding into positive territory at 318.14, while the RSI sits at 58.35, firmly bullish but with room to run before overbought territory. The 200-day EMA at $82,816 marks the next major target if the current momentum holds.
What the indicators confirm
- MACD: Bullish crossover intact, histogram expanding green → momentum is building, not fading
- RSI (58.35): Firmly in bullish territory but not overbought — plenty of room to run
- EMA stack: 50 EMA curling up toward the 100 EMA — a golden cross setup is forming
Institutional demand is providing the fuel. According to SoSoValue data as of April 17, US spot Bitcoin ETFs recorded $663.91 million in net inflows, pushing cumulative inflows to $57.74 billion and total net assets to $101.45 billion, now representing 6.55% of Bitcoin’s market cap.
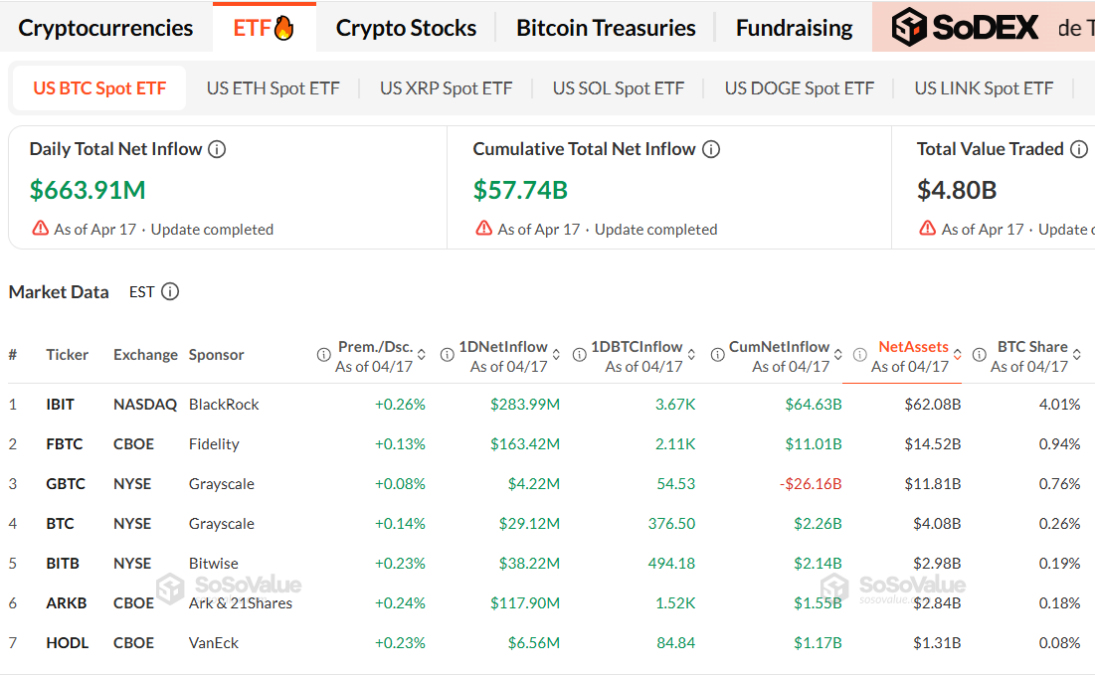
BlackRock’s IBIT led with $283.99 million in single-day inflows and holds $62.08 billion in net assets, commanding a 4.01% share of circulating BTC. Fidelity’s FBTC followed with $163.42 million, while ARK’s ARKB pulled in $117.90 million.
CryptoQuant analyst BorisD noted that Bitcoin Open Interest has climbed approximately 10% over the past 30 days, with price trending upward for 22 consecutive days after forming a base near $60,000 earlier this year.
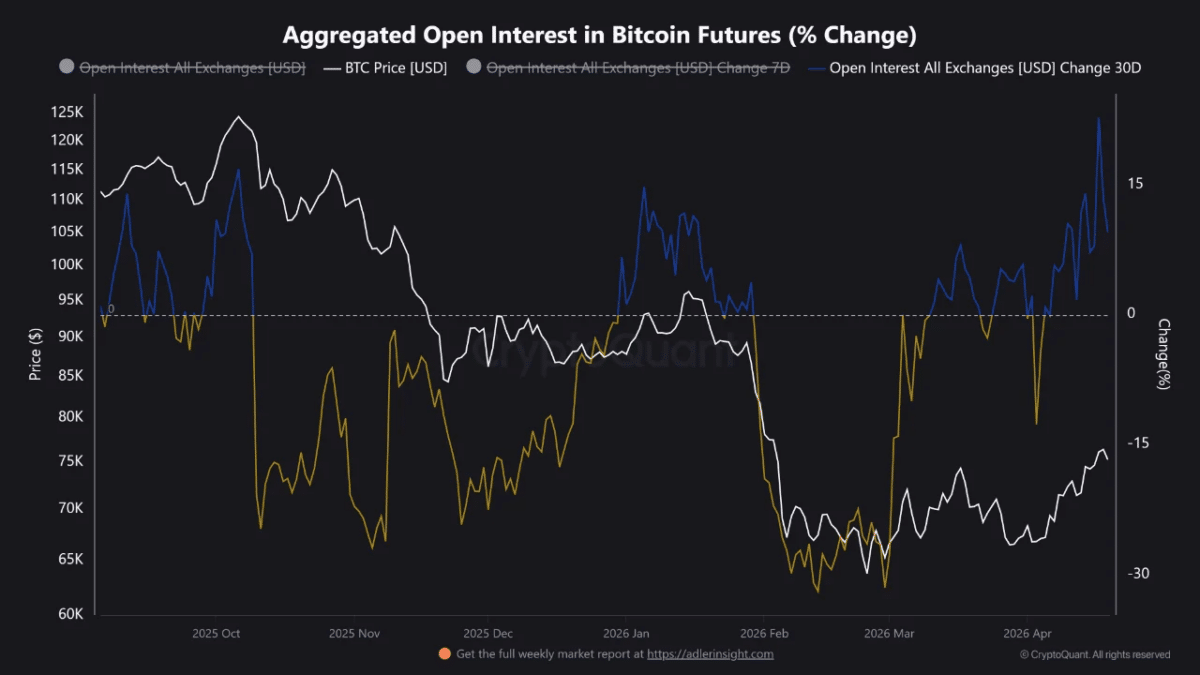
The analyst described the current setup as “calm on the surface, but underneath, pressure is building fast,” pointing to position accumulation rather than exhaustion.
Ethereum breaks trendline as Binance buying pressure hits multi-year high
Ethereum (ETH/USDT) is trading at $2,296 (+1.47%), having broken out of the descending trendline from the January 2026 peak and reclaimed the 50-day EMA at $2,210. The token is now contesting the 100-day EMA at $2,353, a level that has rejected every rally since February.
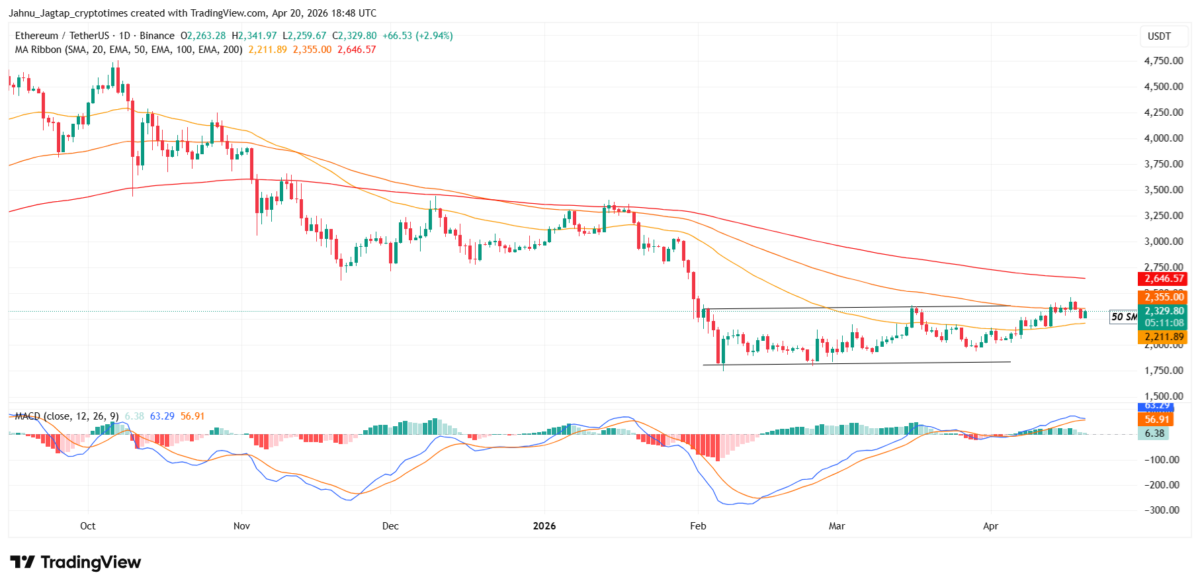
The MACD has flipped bullish with the histogram at 4.26, and the RSI at 54.78 sits in neutral-bullish territory. A daily close above $2,353 would confirm the breakout and open the path to the 200-day EMA at $2,628, while a failure would send price back into the $2,000–$2,200 consolidation range.
What the indicators confirm
- MACD: Sitting just above the zero line with a bullish crossover — the momentum reset is complete
- RSI (54.78): Neutral-bullish, zero overheating
- Key takeaway: The 50 EMA is about to cross the 100 EMA — a true golden cross is days away
The on-chain picture supports the technical setup. CryptoQuant analyst CryptoOnchain flagged that the 50-day Simple Moving Average of the Ethereum Taker Buy/Sell Ratio on Binance has reached 1.018, the highest level since the last major trend reversal.
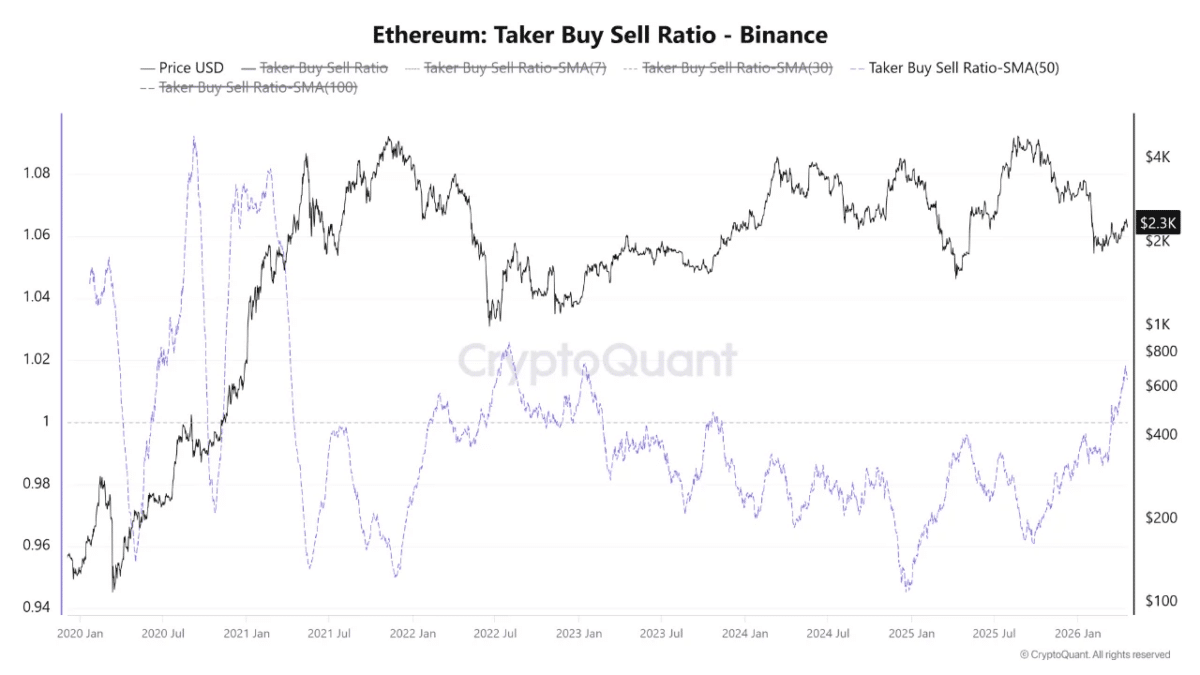
The metric indicates that aggressive market buyers have consistently outpaced sellers on a 50-day rolling basis, a structural shift in sentiment that typically precedes sustained moves.
Spot Ethereum ETFs recorded $127.49 million in net inflows on April 17, with cumulative inflows now at $11.94 billion and total net assets at $14.26 billion, representing 4.87% of Ethereum’s
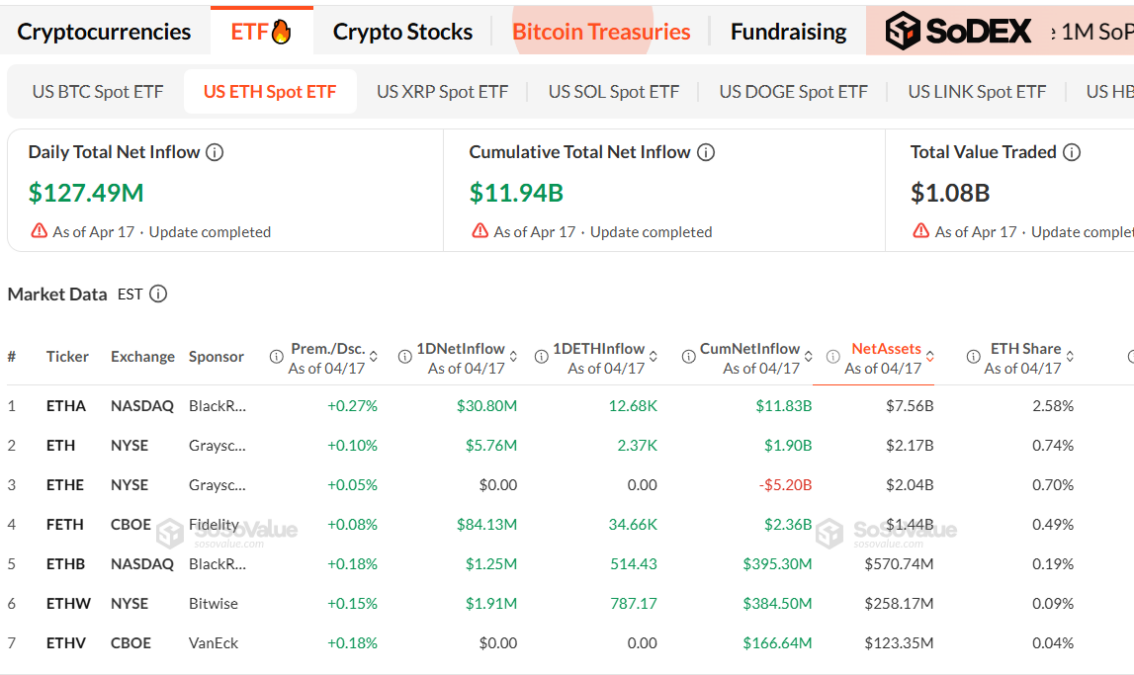
Fidelity’s FETH led the session with $84.13 million in inflows, followed by BlackRock’s ETHA at $30.80 million. Grayscale’s ETHE saw zero flows, continuing its pattern of outflow pressure with a cumulative outflow of $5.20 billion since launch.
XRP reclaims the trendline, but exchange reserve divergence flags caution
XRP/USDT is trading at $1.4128 (+1.33%), having broken the descending trendline from the January 2026 peak near $2.40. Price is now sitting between the 50-day EMA at $1.41 and the 100-day EMA at $1.54, with the MACD flipping bullish and the RSI at 53.94 after cooling from a recent push higher.
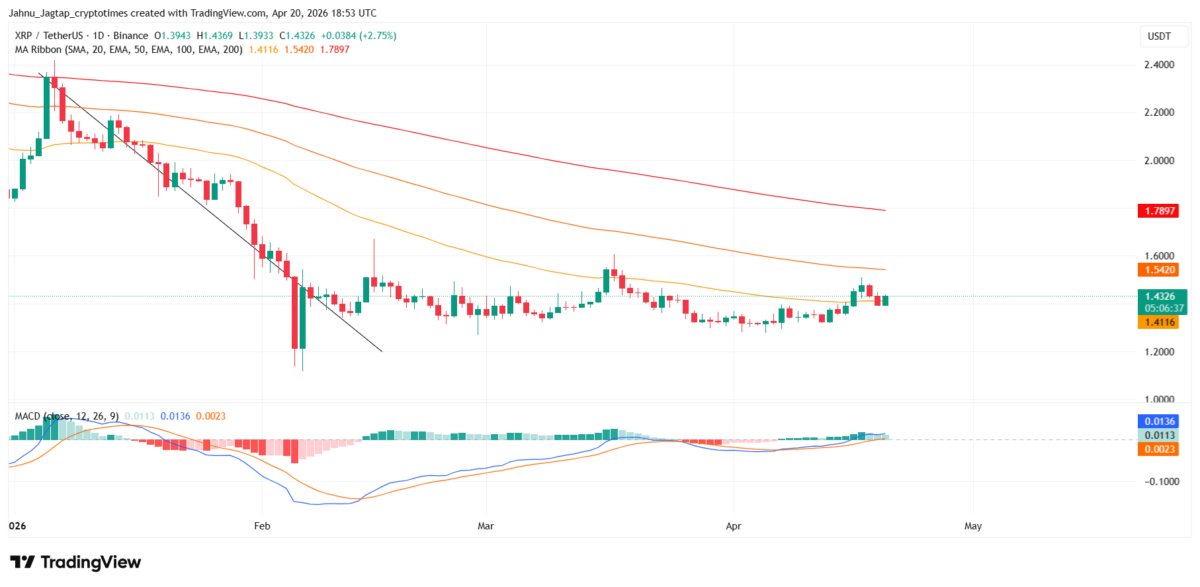
The key resistance at $1.54 marks the level XRP must clear to confirm a broader trend reversal, with the 200-day EMA at $1.79 representing the next major target. Support sits at the February low near $1.20, a break of which would invalidate the current base structure.
What the indicators confirm
- MACD: Bullish crossover with histogram flipping green
- RSI (53.94): Neutral — recently cooled from an overbought push, healthy reset
- Structure: Consolidation tightening directly at trendline resistance
However, an on-chain divergence is flashing caution. CryptoQuant analyst PelinayPA highlighted that XRP exchange reserves on Binance have remained stable to slightly rising while price has drifted lower, breaking a long-running correlation.
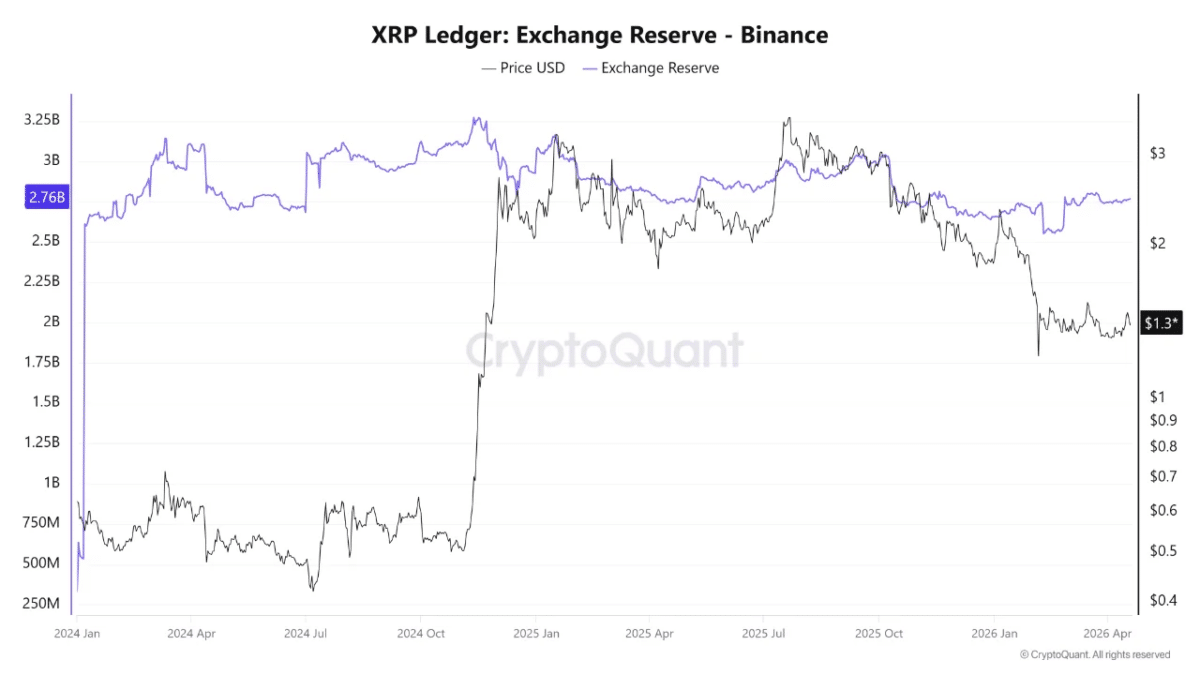
Historically, when reserves increase as price weakens, the pattern resolves either through a supply-driven flush or accumulation-driven recovery, making the next move directionally significant.
Spot XRP ETF flows reflect a much earlier stage of institutional adoption. Total net assets across US spot XRP ETFs stand at $1.11 billion, representing just 1.22% of XRP’s market cap, a stark contrast to Bitcoin’s 6.55%.
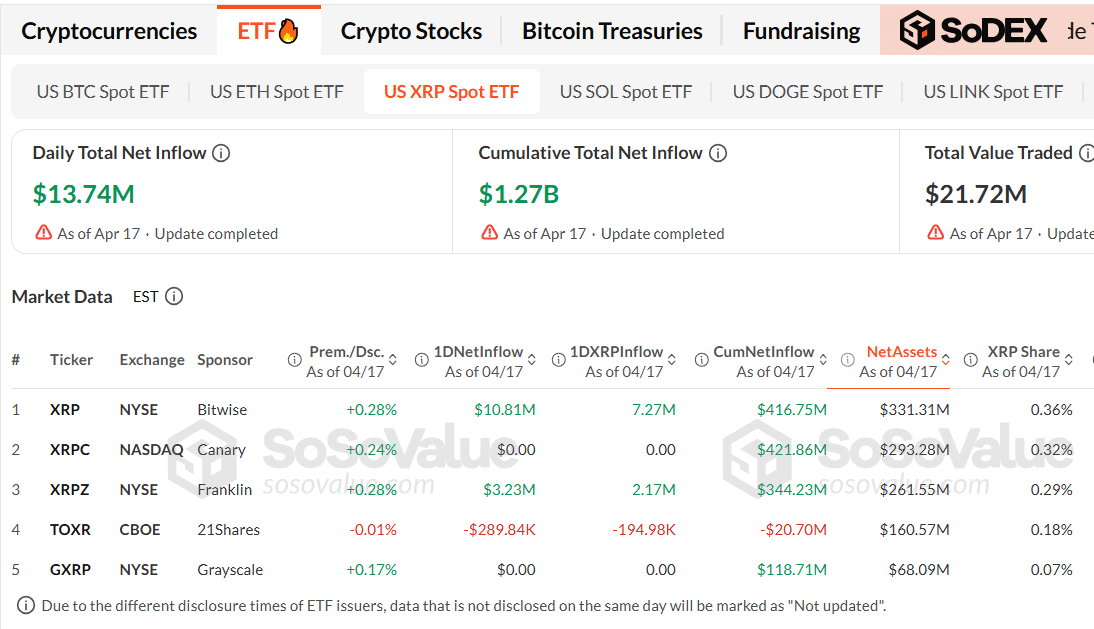
Daily net inflows came in at $13.74 million on April 17, with cumulative inflows reaching $1.27 billion. Bitwise’s XRP led with $10.81 million in inflows and $331.31 million in net assets, while Franklin’s XRPZ added $3.23 million. All XRP ETF products were marked “Closed” at the time of the snapshot.
Technical outlook: Three majors, one synchronized setup
What makes the current setup unusual is the near-perfect alignment across BTC, ETH, and XRP. All three have broken descending trendlines drawn from their respective late-2025 or early-2026 peaks, reclaimed their 50-day EMAs, and are now contesting the 100-day EMA as immediate resistance. The RSI readings on all three sit in the bullish 53–58 range, and the MACD has flipped positive on each chart.
A confluence of this kind across the top three majors is historically rare outside of regime shifts. If BTC closes above $75,300, ETH above $2,353, and XRP above $1.54 on the daily timeframe, the market would confirm a structural transition from the multi-month downtrend that has defined 2026 to date.
What comes next
The next two weeks are shaping up as a decisive window for the crypto market. With BTC ETF inflows accelerating, Open Interest climbing, and Ethereum on-chain buying pressure at multi-year highs, the technical and flow pictures are aligned to the upside for the first time in months.
A failure at the 100-day EMAs across all three majors would mark the current rally as a failed breakout and send price back to retest the February lows. A successful breakout, however, would confirm the structural bottom and open paths to the 200-day EMAs: $82,800 for Bitcoin, $2,628 for Ethereum, and $1.79 for XRP.
As CryptoOnchain’s data on Ethereum buying pressure and BorisD’s Open Interest analysis suggest, the underlying flow signals are shifting ahead of price. Until all three majors clear their respective 100-day EMAs on a daily closing basis, however, the move remains a potential reversal rather than a confirmed one.
Also Read: Calm Before the Storm: Bitcoin’s Onchain Signals Hint at Push Toward $80K