Key Highlights
- A cross-chain exploit allowed attackers to mint 1 billion fake DOT tokens on Ethereum.
- After the attack, DOT saw high trading activity (about $275M volume) while the price fell to $1.17 from $1.24, showing an increase in selling pressure.
- The market turned bearish with over $1million in long liquidations and negative funding rates showing heavy selling pressure.
Following the earlier attack on Polkadot (DOT), after a cross-chain exploit led to the minting of 1 billion fake DOT tokens, the token on the surface doesn’t seem to be reacting much, as it sees a modest 4% drop hours later. However, on-chain activity tells a different story.
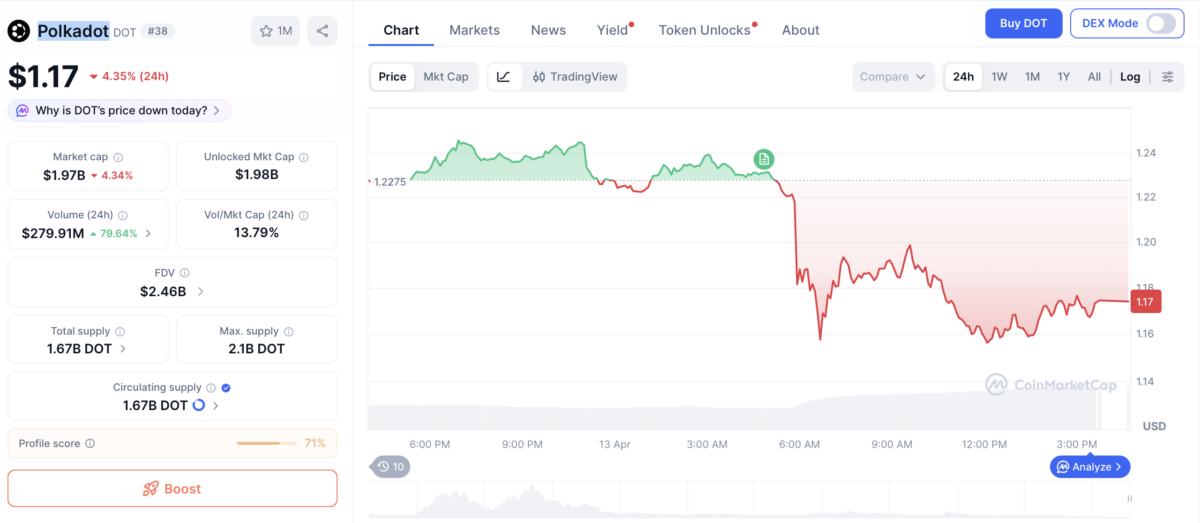
At the time of writing, the token is down to $1.17 from an intraday high of $1.24. Trading activity is through the roof, with over 78% recorded so far, leading to about $275 million in volume, while its market cap has dropped by 4% to about $1.97 billion.
How the attack happened
The exploit happened on Hyperbridge’s gateway contract on Ethereum. The hackers took advantage of a weakness in the cross-chain messaging system to gain unauthorized control over a Polkadot-related token contract deployed on Ethereum.
Blockchain security firm CertiK was quick to flag the attack, saying that it exploited the Interoperable State Machine Protocol (ISMP), a system designed to verify messages sent between blockchains such as Ethereum and Polkadot.
The attacker reportedly minted approximately 1 billion DOT tokens on Ethereum, far more than the reported ERC-20 supply of around 356,000 DOT tokens on the Ethereum network. These fake tokens were then quickly sold using tools called OdosRouter and Uniswap V4. These tools are used for swapping tokens without a middleman.
The hacker exchanged the tokens for about 108.2 ETH, which was sent to their private wallet. The profit is estimated at around $237,000, but it stayed limited because there was not much money available in the trading pools.
The exploit involved bridging DOT on Ethereum, not native DOT on the Polkadot network itself. Because of this, the attacker’s ability to extract value was limited by liquidity in those specific pools. Had the exploit directly affected native DOT supply, the market reaction could have been significantly more severe, both in terms of price decline and broader investor confidence.
Market reaction and on-chain pressure
Shortly after the attack, market activity around DOT became very active, including the on-chain and derivatives data. DOT’s trading volume as of now has reached an 18-day high, and the price is still trading in a downtrend, meaning traders are exiting their positions rather than buying.
According to data from Coinglass, about $1.16 million has been liquidated from the market in an over 24 hour period, which makes it the highest in a month. Liquidations occur when traders using borrowed funds are forced to close positions after losses exceed required margin levels. This forced selling adds additional supply to the market and can increase downward price movement.
So far, about $1.10 million from the total liquidation is from traders who had bet on the price of the token going up, while the rest came from short positions.
At the same time, the funding rate data remained negative at around -0.0227%, which indicated that those holding short positions are dominating the futures market and are paying to maintain their positions.
Technical view on the daily timeframe
On the technical side, DOT had been trading downwards even before the attack. Price has been ranging around a support level since February. However, current sentiment is pushing the price down, toward breaking the support to the downside.
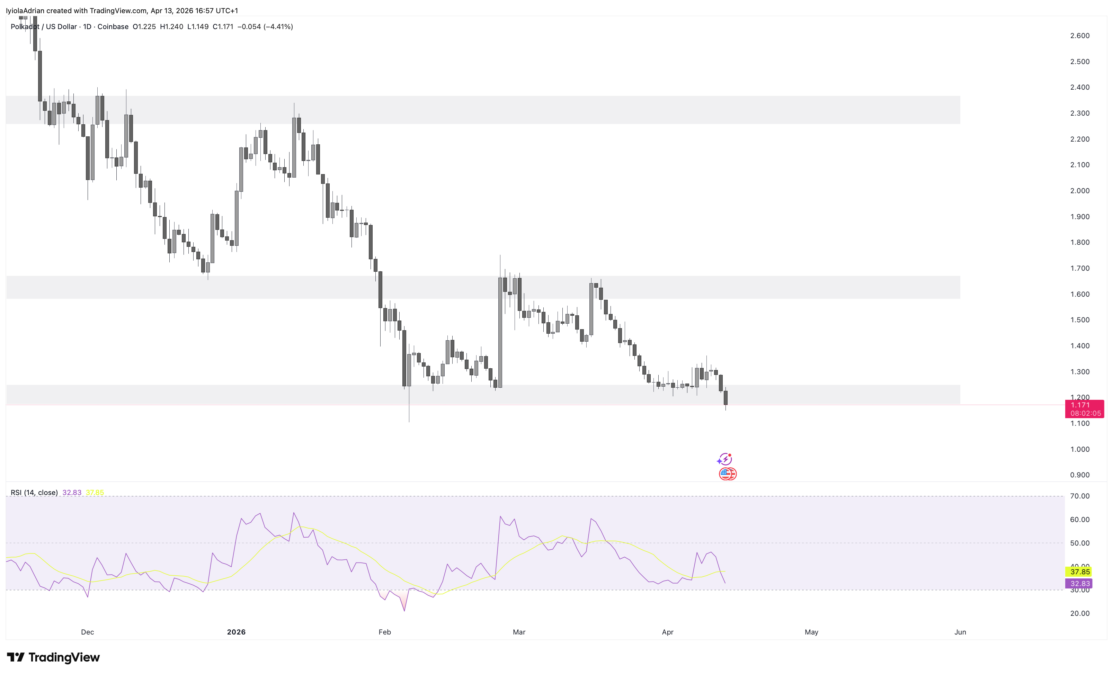
In addition, the Relative Strength Index (RSI) is at 32, which confirms that sellers are in control.
Key levels to watch
At the time of this writing, DOT is trading around $1.17, just above a key support zone between $1.10 and $1.20. If the selling pressure continues, there’s a possibility that DOT could drop below $1, especially if it fails to maintain its current support. A more severe drop can lead the price to $0.9.
The upside, any relief bounce would first need to reclaim $1.24, then $1.30, to signal that buyers are starting to stabilize price action. Beyond that, stronger resistance remains near $1.60 to $1.70, which is where the broader bearish structure would begin to face a more meaningful test.
Also Read: RaveDAO (RAVE) Pump Continues: 98% Supply Control, and Faded CZ/Trump Jr. Connections in Question