Key Highlights
- BTC has traded under the 2-Year MA (multiplier <1) for ~1.5 months since early February, marking a return to the long-term “value zone” after the 2025 peak correction.
- Past cycles saw dips lasting 10–13 months on average (e.g., 11–13 months in 2018–2019, 10–13 in 2022–2023), pointing to possible consolidation into late 2026 or early
- These below-MA periods have historically preceded major rallies with 10x+ gains from accumulation phases, though current macro pressures may extend the grind.
Bitcoin’s long-term valuation indicator is flashing a familiar warning sign as the cryptocurrency lingers in correction territory.
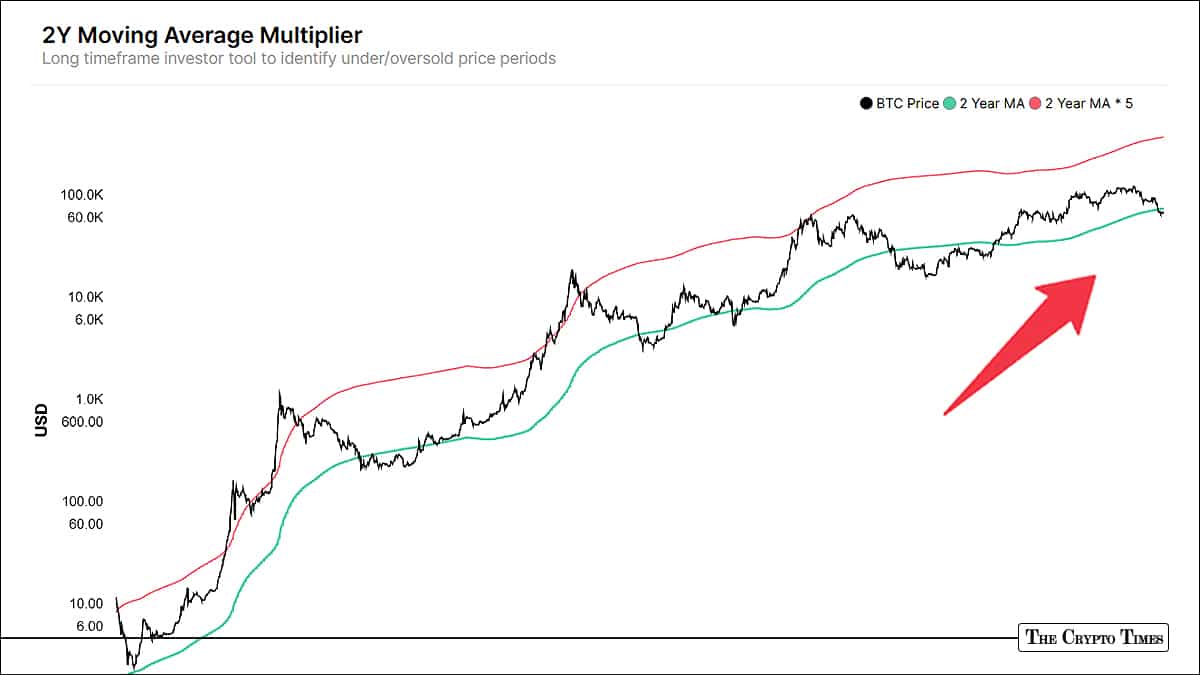
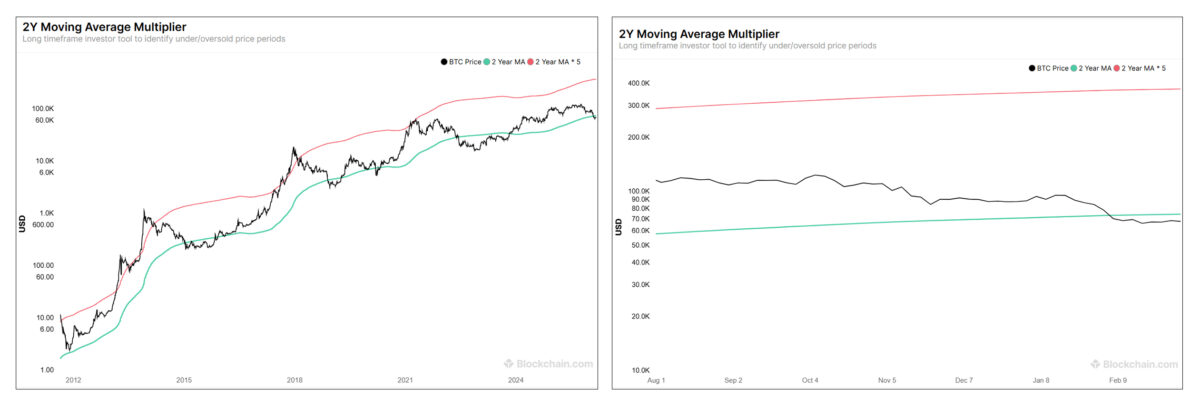
The 2-Year Moving Average Multiplier, dividing current price by Bitcoin’s 730-day simple moving average, now sits below 1.0 (green line), indicating that BTC is trading under its two-year moving average. This level is called a “value zone” among technical analysts, and it is usually tracked to measure the cryptocurrency’s long-term timeline.
This crossover happened in early February 2026, shortly after Bitcoin dipped below $70,000 amid heavy selling pressure from macro headwinds, ETF outflows, and lingering post-halving digestion. As of today, the price has remained below the green line on standard charts from Blockchain.com explorer.
Historically, these dips below the two-year MA have marked some of the best entry points of past cycles, but they rarely resolve quickly. In the brutal 2014–2015 bear market, Bitcoin stayed under the line for around 13–16 months following the 2013 top. The 2018 crash saw roughly 11–13 months below before a sustained recovery. The 2022 drawdown lasted about 10–13 months, bottoming near $16,000 before the climb back above.
Across major cycles, the average stretch below the two-year MA runs 10–13 months, though later ones have trended shorter as Bitcoin’s market matures and institutional participation grows. Early cycles dragged longer amid thinner liquidity and bigger shocks like Mt. Gox.
If the current episode follows the recent pattern, Bitcoin could remain suppressed under the average for another 8–11 months, potentially carrying into late 2026 or early 2027, before a decisive bounce. That timeline assumes no rapid macro reversal, such as aggressive Fed easing or fresh regulatory tailwinds, which could shorten the period.
Although the indicator itself is no crystal ball; it’s a lagging macro tool designed to highlight extremes rather than pinpoint trades. Still, its track record is striking with the prolonged time below the line preceded multi-year rallies with 10x-plus gains from deep oversold levels. Right now, with sentiment deeply fearful and long-term holders showing signs of exhaustion rather than panic, the setup echoes classic accumulation phases—even if the road feels grinding.
At the time of publishing, Bitcoin was trading at $69,950, briefly touching $70,000—a swift recovery from last week’s low near $65,000—as per CoinMarketCap data. The largest cryptocurrency is currently down nearly 45% from its all-time high of $126,198, recorded in October 2025.
Also read: Bhutan Sells 175 Bitcoin Worth $11M Amid Price Surge