Crypto markets do not always crash because of one bad headline. Many times, the first price drop is only the trigger. The more serious damage begins when leveraged traders are forced out of their positions.
The forced exit creates automatic buying or selling pressure across exchanges. When too many traders are on the same side of the market, the process can become violent. A normal correction can quickly turn into a liquidation cascade.
This is why liquidation data matters during major crypto selloffs. It helps explain whether the market is simply falling because traders are selling, or whether forced deleveraging is making the crash worse.
What is leverage in crypto trading?
Leverage allows traders to open positions larger than the capital they actually deposit. Crypto derivatives can offer extremely high leverage (sometimes 100× or more), meaning a small price move can wipe out a trader’s margin. Exchanges set an initial margin (collateral to open a position) and a smaller maintenance margin.
For example, with 10x leverage, a trader can control a $10,000 position using only $1,000 as margin. If the trade moves in the right direction, profits are amplified. If the trade moves against the trader, losses are also amplified.
This is where the risk begins. At 10x leverage, a 5% move against a position can wipe out a large portion of the trader’s margin. At 50x or 100x leverage, even a small market move can destroy the position.
Leverage does not create crashes by itself. But when too many traders use high leverage in the same direction, the market becomes fragile.
What is a liquidation?
A liquidation happens when an exchange automatically closes a leveraged position because the trader no longer has enough margin to keep it open.
Every leveraged trade requires collateral. This collateral protects the exchange if the trade moves against the trader. When losses eat through that margin buffer, the exchange steps in and closes the position.
If a trader is long, the exchange closes the position by selling. If a trader is short, the exchange closes the position by buying.
In calm markets, liquidations happen in small amounts. In stressed markets, they can arrive in waves and make the selloff much worse.
How liquidations create a crash loop
The biggest danger is the feedback loop.
When prices fall, leveraged long positions start losing margin. Once those positions hit liquidation levels, exchanges automatically close them. This usually means selling into the market.
This extra selling pushes prices even lower. The lower price then triggers more liquidations. Those liquidations create more selling, and the cycle continues.
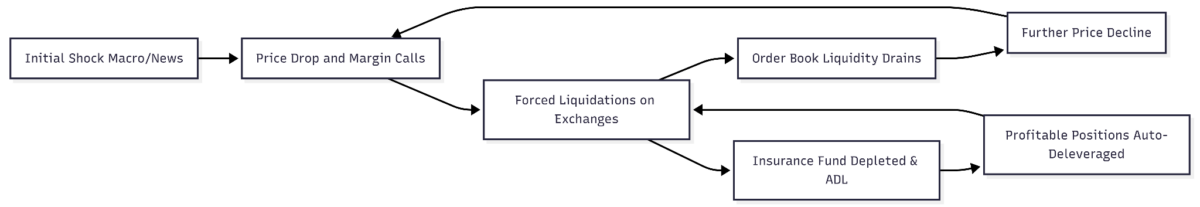
The Liquidation Loop
- Price falls
- Long positions lose margin
- Exchanges liquidate those positions
- Forced selling hits the market
- Price falls further
- More long positions get liquidated
This is how a correction turns into a crash. The market is no longer only reacting to sentiment. It is being pushed lower by automatic liquidation engines.
Long liquidations vs short liquidations
Liquidations can happen on both sides of the market.
A long liquidation happens when traders betting on higher prices are forced out because the asset price falls. This creates selling pressure.
A short liquidation happens when traders betting on lower prices are forced out because the asset price rises. This creates buying pressure.
| Type of Liquidation | What Triggers It | Market Impact |
|---|---|---|
| Long liquidation | Price falls | Forced selling |
| Short liquidation | Price rises | Forced buying |
| Liquidation cascade | Many positions are liquidated together | Sharp price acceleration |
Most crypto crashes are made worse by long liquidations because falling prices force exchanges to sell more assets into already weak markets.
Why liquidity disappears during liquidation events
Liquidity refers to the market’s ability to absorb buy and sell orders without causing large price swings.
During a crash, liquidity often disappears when it is needed most. Market makers widen spreads, traders pull buy orders, and order books become thinner. This makes the market easier to move.
When liquidation engines start selling into thin order books, prices can fall much faster than expected. Even moderate forced selling can cause sharp moves if there are not enough buyers.
This is why leverage and weak liquidity are a dangerous combination. Leverage creates forced selling, while poor liquidity makes that selling more damaging.
How exchanges handle liquidations
Crypto derivatives exchanges use liquidation engines to manage risk. These systems monitor margin levels and automatically close positions that fall below required thresholds. The goal is to prevent traders from losing more than their collateral and to protect the exchange from unpaid losses.
However, liquidation engines can also intensify market stress. When many traders are liquidated at once, the exchange may need to close a large number of positions in a falling market.
This can deepen volatility, especially when order books are thin.
The role of insurance funds and auto-deleveraging
Most derivatives exchanges maintain insurance funds. These funds are designed to cover losses when a liquidated position cannot be closed at a price that fully protects the exchange.
In extreme volatility, prices may move so quickly that a trader’s collateral is not enough to cover the loss. The insurance fund helps absorb that gap.
But insurance funds are not unlimited. If losses become too large, some exchanges use auto-deleveraging, also known as ADL.
Under ADL, profitable traders on the opposite side of the market may have their positions reduced automatically to cover losses from bankrupt liquidations.
This means liquidation risk can spread beyond traders who used excessive leverage. In extreme cases, even profitable traders can be affected by the exchange’s risk system.
Why funding rates matter
Perpetual futures are widely used in crypto trading. Unlike traditional futures, they do not expire. To keep perpetual contracts close to spot prices, exchanges use funding rates.
When too many traders are long, funding rates usually become positive, meaning longs pay shorts. When bearish pressure rises, funding can turn negative.
Funding rates are important because they show how crowded positioning has become.
If the market is heavily long and prices begin to fall, liquidation risk increases. If too many traders are short and prices rise sharply, short liquidations can trigger a rally.
Funding does not cause every crash. But during liquidation-heavy events, it helps reveal whether the market is dangerously one-sided.
Real examples of liquidation cascades
Black Thursday: March 2020
Glassnode’s March 2020 insights report shows why Black Thursday remains one of the clearest examples of leverage turning panic into forced selling.
Bitcoin fell 19% in a single hour and dropped below $5,000 on some exchanges during the selloff. Glassnode also noted that more than $500 million worth of BTC long positions were liquidated on BitMEX during the move.
These were not normal spot holders choosing to sell. Many leveraged long traders were forced out by liquidation engines.
Once those forced liquidations hit the market, order books had to absorb sell pressure at the worst possible moment. When liquidity thinned, each forced sale pushed the price lower, triggering more liquidations.
Black Thursday showed that even Bitcoin, the most liquid crypto asset, can become fragile when leverage is crowded and market depth disappears.
May 2021 Flash Crash
The May 2021 crash followed a strong crypto bull market, when leverage had built up across the market.
Chainalysis data showed Bitcoin trading as high as around $58,000 on May 12 before falling to around $36,000 on May 19. Ethereum also dropped from its then all-time high of $4,308 to nearly $2,200 during the same period.
Glassnode’s review of the selloff showed that Bitcoin fell 47.3% from May 9 and printed the largest daily candle in its history at the time, with an intraday range of $11,506.
The derivatives data made the event even more important. Glassnode said futures open interest had peaked at $27.4 billion in mid-April, but more than 60% of that open interest was cleared from the market during the deleveraging.
That means more than half of the futures positioning built during the bull run was wiped out. The market was not only falling because traders were selling. It was also falling because leveraged exposure was being forcibly removed.
This is the liquidation cascade in practice: crowded long positions, falling prices, forced closures, thinner liquidity, and another round of selling. A mix of negative sentiment, policy concerns, and weakening confidence triggered selling. Once prices started falling, leveraged positions began to unwind quickly.
Bitcoin and Ethereum both dropped sharply, while billions of dollars in positions were liquidated across the market. Exchange infrastructure also became part of the problem, as some platforms struggled during the stress.
This showed that liquidation cascades can become worse when traders cannot add margin, reduce exposure, or close positions in time.
Terra-LUNA Collapse
The Terra-LUNA collapse began differently. It was not a classic derivatives-led crash at first. It started with UST losing its dollar peg and confidence collapsing across the Terra ecosystem.
MIT’s blockchain and exchange-trading data study found that Terra, then one of the largest crypto ecosystems, lost around $50 billion in valuation in three days. The study placed Anchor at the center of the run, as UST holders began exiting a lending system built around high stablecoin yields.
Leverage helped spread the damage. As UST broke down and LUNA collapsed, collateral values were destroyed. Traders, funds, and platforms exposed to Terra-linked assets faced margin stress. Forced unwinds then spread into the broader crypto market.
The key lesson from Terra is that leverage does not only exist in futures markets. It can also be hidden inside stablecoin designs, yield products, lending platforms, and collateral structures.
Also Read: Terra Luna Classic (LUNC) Evolution, Governance, and the 2026 Resurgence
FTX and Alameda Collapse
The FTX collapse was driven by balance-sheet weakness, trust failure, and concerns around FTT-backed exposure.
It was not simply a public derivatives liquidation event. But leverage was still central to the damage.
Kaiko’s later market-depth research showed why exchange liquidity needed to be studied more carefully after FTX. The data found that Bitcoin’s 1% market depth before and after the FTX collapse revealed important differences across trading venues. Kaiko also noted that some of the earlier depth increases were linked specifically to FTX and FTX US, both connected to Alameda Research.
Separate quantitative research on the FTX collapse used hourly prices, on-chain data, and public transaction data to study the failure. The paper found that FTX relied heavily on FTT, its own exchange token, and that this leverage mechanism worsened the firm’s fragile position.
Once confidence in FTX and Alameda broke, FTT collapsed, withdrawals surged, and the market began repricing risk across the industry. The result was forced deleveraging, collateral destruction, and sharp selling across crypto assets.
FTX showed that hidden leverage on private balance sheets can be just as dangerous as visible leverage on derivatives exchanges.
What these crashes have in common
Each of these crashes had a different trigger.
Black Thursday came from global macro panic. The May 2021 crash followed a sharp sentiment reversal. Terra was driven by a stablecoin and ecosystem collapse. FTX stemmed from exchange insolvency and collateral concerns.
| Crash Event | Date | Price Decline | Liquidations (USD) | Leverage | Key Trigger(s) |
|---|---|---|---|---|---|
| Black Thursday 2020 | 12–13 Mar 2020 | BTC ~$8k → $3.8k (–50%) | BitMEX longs ~$843M (daily) (~3.5% of OI) | ~20–60× (avg) | COVID-19 market panic; oil collapse |
| Flash Crash 19 May 2021 | 19 May 2021 | BTC ~$40k → $30k (–25%), ETH –46% | ≈$8B across markets | High (tens of ×) | China crypto ban; Elon Musk tweet; Binance outage |
| Terra/LUNA Collapse May 2022 | 7–13 May 2022 | UST $1 → ~$0; LUNA ~$90 → ~$0 | ~$18B trader losses | Algorithmic (implicit) | UST stablecoin depeg (Anchor run) |
| FTX/Alameda Collapse Nov 2022 | 2–11 Nov 2022 | BTC ~$21k → ~$16k (–25%); FTT –95% | Systemic (Billions) (exact unsettled) | Extreme (FTT used as collateral) | Alameda’s hidden FTT holdings |
But all four events shared one weakness: leverage made the downside worse.
The first shock started the move. The forced unwind made it larger.
That is the main lesson of liquidation cascades. Crashes are not always caused by leverage, but leverage can determine how violent they become.
Why crypto is more vulnerable than traditional markets
Crypto markets are especially exposed to liquidation cascades for several reasons.
High Leverage
Many crypto platforms have historically offered very high leverage. At 50x or 100x, even normal price volatility can wipe out positions.
24/7 Trading
Crypto does not have a closing bell. There is no overnight pause and no single coordinated halt across all exchanges.
Fragmented Liquidity
Liquidity is spread across multiple venues, trading pairs, and derivatives products. This makes stress harder to contain.
Crowded Speculation
Crypto markets are heavily speculative. During bull markets, traders often crowd in the same direction. When the market turns, that crowding becomes dangerous.
Together, these factors make crypto more vulnerable to sudden liquidation cascades.
What traders should watch
Liquidation risk can build quietly before a crash. Traders should watch several indicators to understand whether the market is becoming fragile.
Open Interest
Rising open interest shows more capital is entering derivatives positions. If price is also rising quickly, leverage may be building.
Funding Rates
Extremely positive or negative funding can show crowded positioning.
Liquidation Data
Large liquidation spikes show forced deleveraging is already underway.
Order Book Depth
Thin liquidity means forced selling or buying can move price more aggressively.
Key Price Levels
Crowded stop-loss and liquidation zones can become magnets during volatility.
No single metric can predict a crash. But together, these indicators can show when the market is becoming unstable.
What exchanges can do better
Exchanges can reduce liquidation risk by limiting excessive leverage, improving margin systems, and using better liquidation logic.
Circuit breakers can slow disorderly markets. Stronger insurance funds can reduce systemic stress. Transparent reporting around open interest, funding, and liquidation flows can help traders understand crowding before it becomes dangerous.
Infrastructure is also important. During major volatility, traders need reliable access to add margin, reduce exposure, or close positions. If platforms fail during stress, liquidations can become worse.
Better risk controls cannot remove volatility from crypto. But they can reduce the chance that a normal sell-off becomes a disorderly crash.
Bottom line
Crypto market crashes are rarely caused by one factor alone. Bad news, weak sentiment, macro pressure, or loss of confidence may start the move. But leverage often decides how severe the crash becomes.
When too many traders are overexposed, a price correction can trigger forced selling. This selling pushes prices lower, causing more liquidations and deeper losses. Such liquidation shows whether the market is selling normally or whether forced deleveraging is taking control.
In crypto, corrections are common. But when leverage is crowded, corrections can quickly become crashes.
FAQs
What does liquidation mean in crypto?
Liquidation means an exchange automatically closes a leveraged trading position because the trader no longer has enough margin to keep it open.
Why do liquidations make crypto crashes worse?
Liquidations create forced market orders. When long traders are liquidated during a price drop, exchanges sell their positions, adding more downward pressure.
What is a liquidation cascade?
A liquidation cascade is a chain reaction where falling prices trigger liquidations, those liquidations push prices lower, and the lower prices trigger even more liquidations.
Are only long traders liquidated?
No. Long traders are liquidated when prices fall. Short traders are liquidated when prices rise. Both can create sharp market moves.
Is leverage always bad?
No. Leverage can be used for trading and hedging. The risk comes from excessive leverage, poor margin management, and crowded positioning.
Why is crypto more vulnerable to liquidation cascades?
Crypto trades 24/7, liquidity is fragmented, leverage can be very high, and many traders often crowd into the same market direction.
Can exchanges stop liquidation cascades?
They can reduce the risk with leverage limits, better margin rules, circuit breakers, stronger insurance funds, and improved infrastructure. But they cannot eliminate the risk completely.
How can traders avoid liquidation?
Traders can reduce liquidation risk by using lower leverage, keeping extra margin, setting stop losses, avoiding crowded trades, and not risking more capital than they can afford to lose.
Why should investors watch liquidation data?
Liquidation data shows whether a price move is driven by normal selling or forced deleveraging. This helps investors understand whether the market is under mechanical stress.
Also Read: What Is Zcash? How the Leading Privacy Coin Works and Why It Matters in 2026
Disclaimer:
Some elements of this content may have been enhanced with the help of our artificial intelligence (AI) assistants for purposes such as basic refinement, review, image generation, and translation to deliver high-quality news in a shorter time frame. However, all AI-assisted content is reviewed and approved by our team to ensure accuracy, fairness, and editorial integrity.