Key Highlights
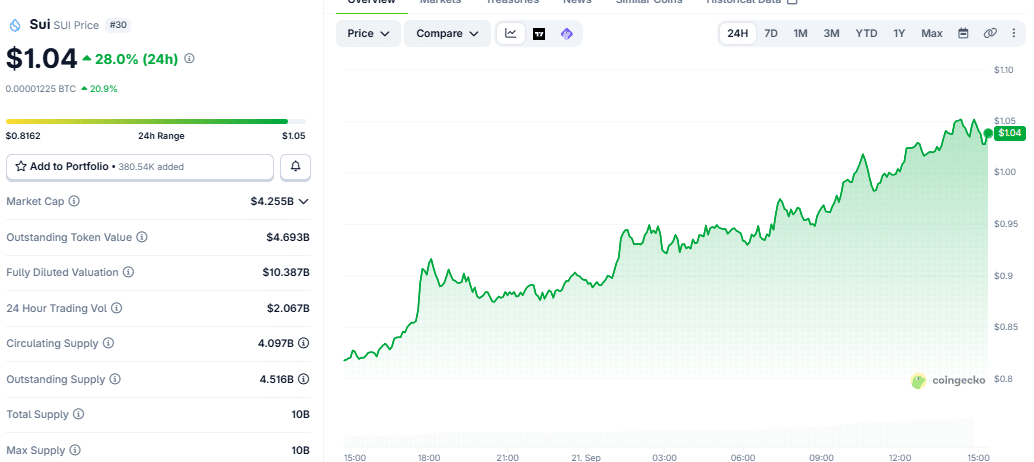
- SUI price jumped 28% in 24 hours to $1.04, pushing its market cap to $4.25 billion.
- Ali Martinez identified bullish technical signals, with $1.03 and $1.40 as key levels to watch.
- SUI’s RSI reached 77, while analysts flagged $0.9725 as a key support level.
SUI price climbed on Monday as the overall crypto market continued to recover, pushing the token back above $1.
Trading activity also increased, with analysts pointing to several technical signals as SUI approached key resistance levels. The focus is now on whether the token can hold above support and break through the $1.05 area.
According to data from CoinGecko as at 2:44 p.m. UTC, SUI was trading at $1.04, up 28% over the past 24 hours. Its market capitalization stood at around $4.256 billion, while daily trading volume reached around $2.067 billion.
The derivative market also recorded higher activity. According to data from Coinglass as of 2:44 p.m. UTC, SUI futures trading volume rose 142.38% over 24 hours to $2.93 billion. Open interest increased 40.31% to approximately $1.05 billion.
Ali Martinez spots bullish signals
Crypto analyst Ali Martinez pointed to several technical signals that could support further gains. In a post on X, he said the Tom DeMark Sequential indicator printed a 13th buy signal in late July. Since then, SUI has gained about 45%, according to his assessment.
Martinez also pointed to the SuperTrend indicator, which has flipped to “buy.” He said this could be a sign that the current move may develop into a wider change from a bearish trend to a bullish one.
“This suggests the rally could extend into a broader macro shift from bearish to bullish momentum,” Martinez said.
Why $1.03 and $1.40 matter for SUI
The Parabolic SAR is another indicator Martinez is watching. He said SUI needs to stay above $0.98 for the signal to develop. With SUI moving above that level, the SAR dot could move below the price, which would support a bullish technical setup.
Martinez also identified $1.03 as an important level on SUI’s weekly chart. He said the token appears to be moving within a parallel channel, with its middle range near $1.03. If SUI breaks above that level, he sees the upper boundary near $1.40 as the next area to watch.
Ucan_Coin watches the $0.9725 support level
Another analyst, Ucan_Coin, is watching the $0.9725 level, which previously marked the top of a range that held for months. If SUI remains above that level and turns it into support, the analyst believes the price could establish a stronger base for another move.
“Structurally, we’re seeing higher lows and higher highs forming, which could mean the trend is changing,” Ucan_Coin said.
The analyst identified $1.0370 as the first target, followed by $1.1637 and then $1.38. However, a move below $0.9725 could weaken the setup and give sellers more control, according to the analyst.
SUI faces resistance near $1.05
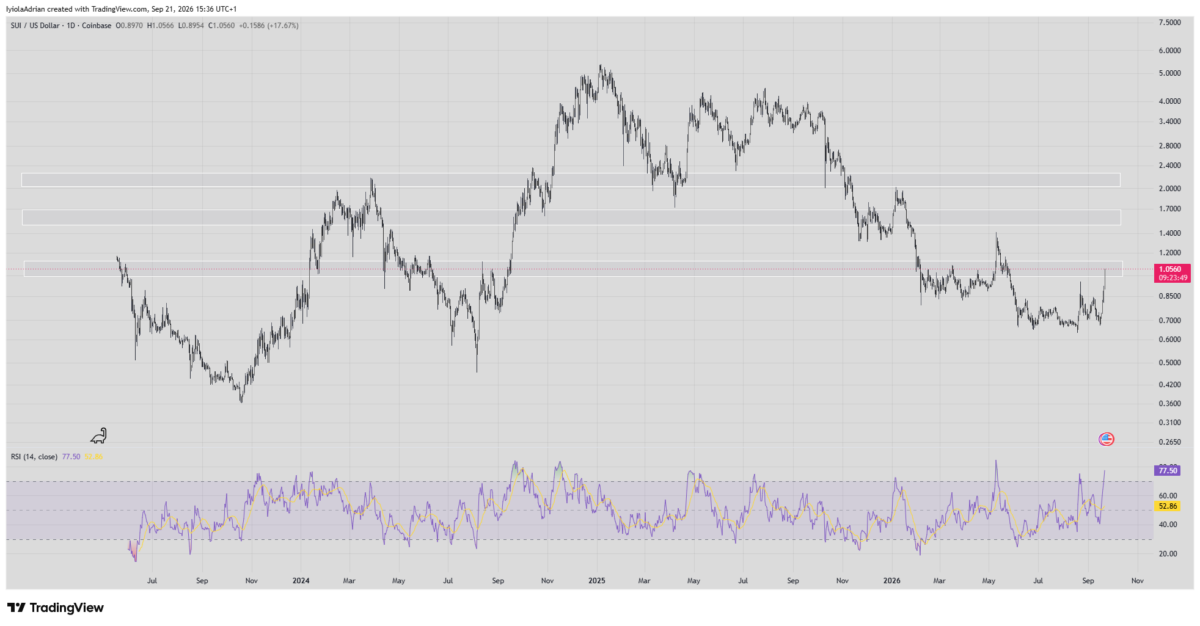
SUI’s latest move comes after a sharp rally in August, when the token climbed from $0.635 to $0.954 in less than five days. It later fell as low as $0.673 before recovering, according to data from TradingView.
The $0.95-$1.05 area is now an important zone for traders, with $1.05 standing out as a key resistance level.
There is also a reason for caution. SUI previously broke above $1.05 in May but failed to hold the move. The Relative Strength Index (RSI) is currently at 77, indicating that SUI is in an elevated momentum range and may be approaching overbought territory.
Other analysts have identified different price levels. Captain Faibik sees a possible move above $3 in the coming months, while Mikybull Crypto has predicted a potential rise to $15. These are individual forecasts, while SUI traders continue to watch whether the token can hold above key support and push through resistance.
Also Read: Crypto Liquidations Hit $795M as Bitcoin Surges 5.7% to $85K