Key Highlights
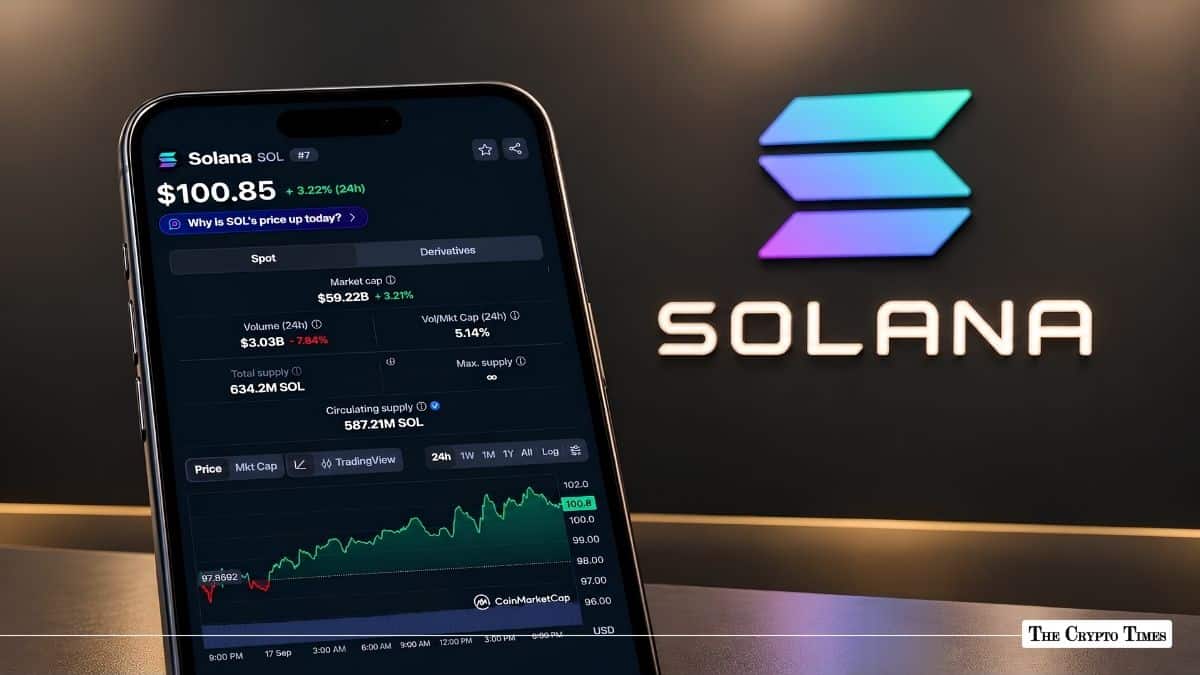
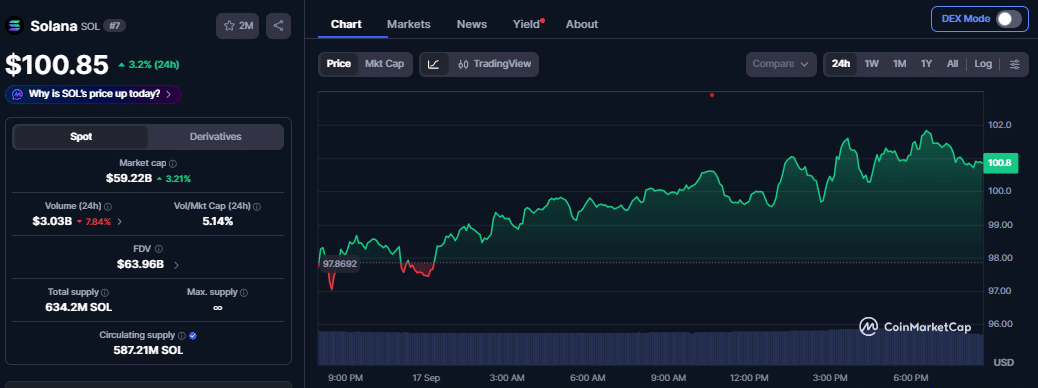
- Solana trades above $100, with SOL up 3.2% at around $100.89.
- $105 is the key breakout level, with a sustained close above it potentially opening the path toward $130.
- Solana ETFs recorded $836,930 in net inflows, while technical indicators showed improving buying momentum.
Solana (SOL) was up 3.2% today, pushing the price above $100 on Thursday. According to data from CoinMarketCap (on September 17 at 8:15 pm UTC), the token was trading for $100.85 at the time of this writing as broader crypto market activity also improved.
The surge pushed Solana’s market cap to approximately $59 billion, with a 24-hour trading volume of about $3.01 billion.
Solana gets closer to a key price level
Traders are watching the $105 level for a possible breakout toward $130 based on a four-hour chart setup.
Crypto analyst Ali said a bull flag appears to be forming on Solana’s four-hour chart. A bull flag is a chart pattern that can form after a strong upward move when the price takes a break and moves within a tighter range before attempting another move higher.
The analyst pointed to $105 as the level that could decide Solana’s next major move.
“SOLANA BREAKOUT IS NEAR,” Ali wrote. “A bull flag appears to be forming on Solana’s 4-hour chart.”
He added that a sustained close above $105 could confirm the breakout and open the door to a rally toward $130.
Simply moving above $105 for a short time may not be enough. Solana would need to hold above the level with a sustained close. If that happens, the $130 target mentioned by the analyst would come into focus.
Solana ETFs see fresh money
Solana’s U.S. spot ETF market also showed activity as the token recovered above $100. According to data from SosoValue, Solana exchange-traded funds recorded a net inflow of $836,930 on September 16.
Bitwise BSOL recorded the largest inflow among the funds, receiving $2.69 million. Grayscale GSOL, however, recorded an outflow of $1.85 million.
The other funds in the seven-product Solana ETF market recorded no new inflows during the session.
Across the products, total net assets stood at $1.38 billion. This represented 2.38% of Solana’s market capitalization. Total trading activity reached $51.57 million, while BSOL had the largest fund balance at $945.76 million.
Technical signals point to stronger momentum
Technical indicators also showed some improvement. The MACD line was at -0.70, above the signal line at -5.94. The MACD histogram was positive at 5.25.
At the same time, the Relative Strength Index (RSI) climbed to 56.17, indicating that buying demand had increased without Solana reaching the overbought area.
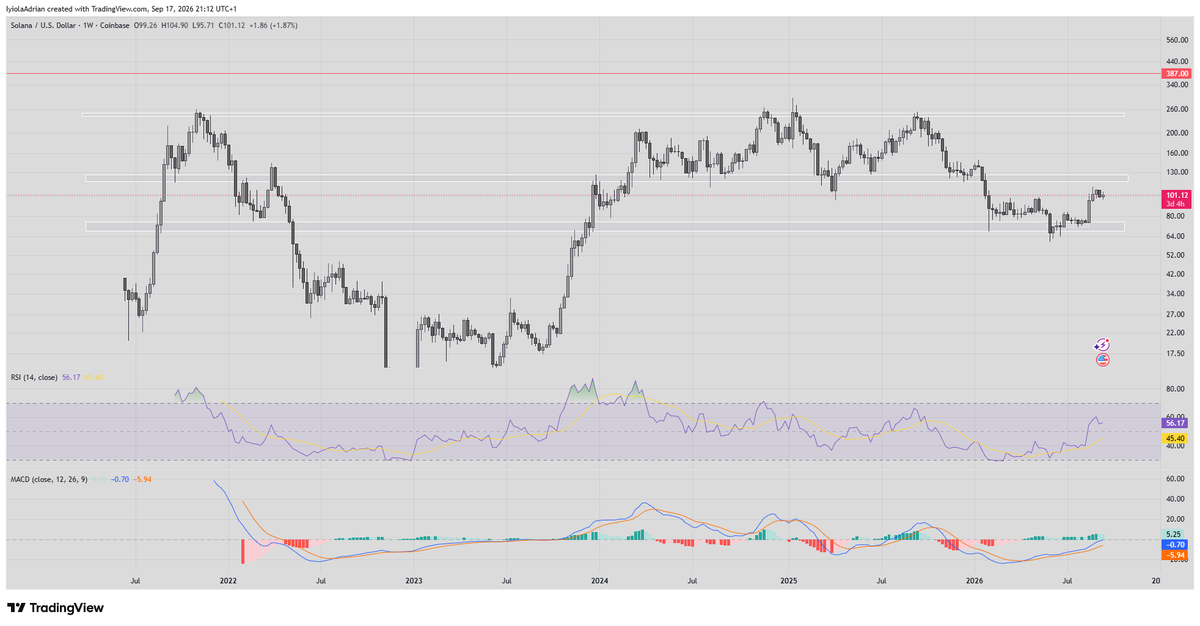
For now, $105 remains the level to watch. If SOL can hold above it, the next resistance highlighted in the analysis is around $110. A close above $110 would bring $120 into view, while the analyst’s larger target remains $130.
If Solana fails to break above $105, however, the token could remain within its current range as traders wait for a clearer direction.
Also Read: Uniswap Token Surges 23.5% as Trading Volume Hits $1.27