Key Highlights
- Uniswap’s UNI token surged 23.5% to $7.65 on Thursday, September 17, briefly reaching $7.75.
- UNI futures trading volume jumped 82.67% to $1.40 billion, while open interest rose 20.81% to $601.45 million.
- UNI broke out of a falling wedge pattern formed after its late-2024 peak. The token faces resistance near $7.78, while $12.70 is the next potential price target if it clears that level.
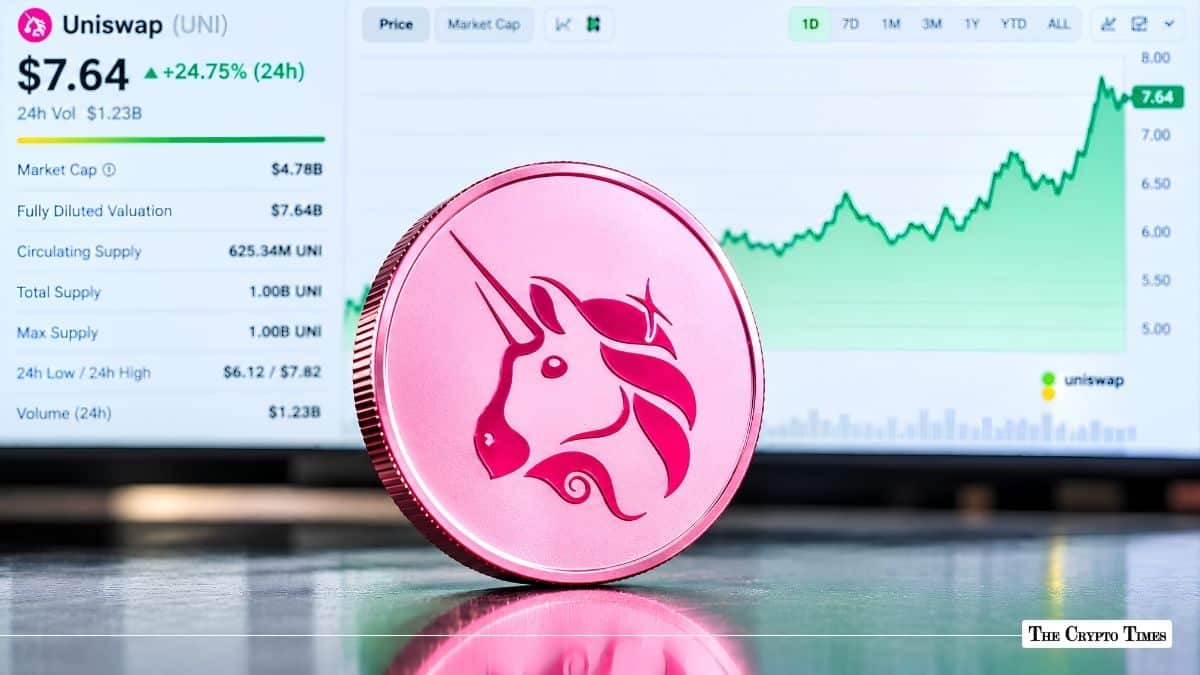
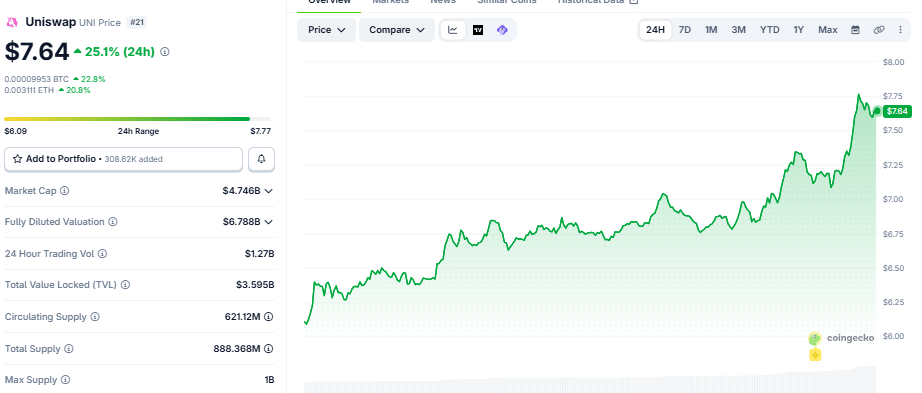
Uniswap’s UNI token jumped 23.5% to $7.65 on Thursday, September 17, after climbing from an intraday low of around $6.22.
The surge came as trading activity increased across the spot and derivatives markets, while UNI also pushed through an important chart pattern. According to data from CoinGecko, the token briefly reached $7.75, lifting its market capitalization to about $4.746 billion.
This surge comes as the trading volume hit $1.27 billion within just 24 hours, with its fully diluted valuation holding up at $6.788 billion.
At the same time, the derivative market is also pulling in positive numbers. According to data from Coinglass, UNI futures trading volume jumped 82.67% to about $1.40 billion, while open interest increased 20.81% to $601.45 million. Open interest tracks the value of active futures positions, so the increase shows that more money was tied to open UNI trades.
The surge also led to several traders being forced out of their positions. Coinglass data shows that about $3.71 million was liquidated in the past 24 hours. Traders who were betting that UNI would fall took the biggest hit, with about $2.95 million in short positions liquidated. Long positions accounted for the remaining $762,950.
UNI breaks out of a falling wedge
Behind the price move is a technical change that has been building for months. UNI broke out of a large falling wedge pattern in August.
The pattern started after UNI reached nearly $19.50 in late 2024 and then moved through a series of lower highs and lower lows.
A falling wedge forms when the price keeps moving lower between two downward-sloping lines that slowly come together. UNI eventually moved above the upper line of that pattern, and the token has continued higher since then.
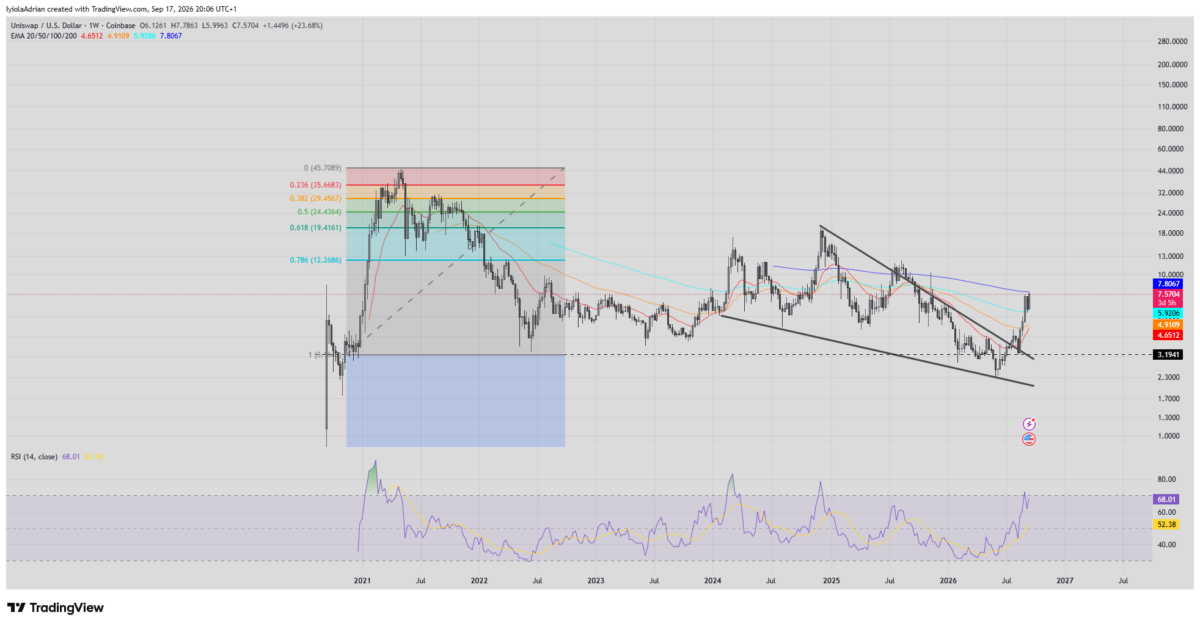
UNI has also moved back above its 20-week, 50-week and 100-week exponential moving averages. These levels were around $4.59, $4.89 and $5.91, respectively. According to the current price action via the TradingView chart, the next major level on the chart is the 200-week EMA near $7.78, which is close to the recent high.
Meanwhile, the weekly relative strength index, or RSI, is currently around 67.91 which shows that buying activity has increased, and the token has not yet moved into deeply overbought territory.
If UNI can close a weekly candle above the $7.78 level, the next target will be $12.70. That level matches the 0.236 Fibonacci retracement and was also an important resistance area during UNI’s 2024 rally.
Also Read: MarsCat’s MCAT Surges 186% as Trading Activity Jumps