Key Highlights
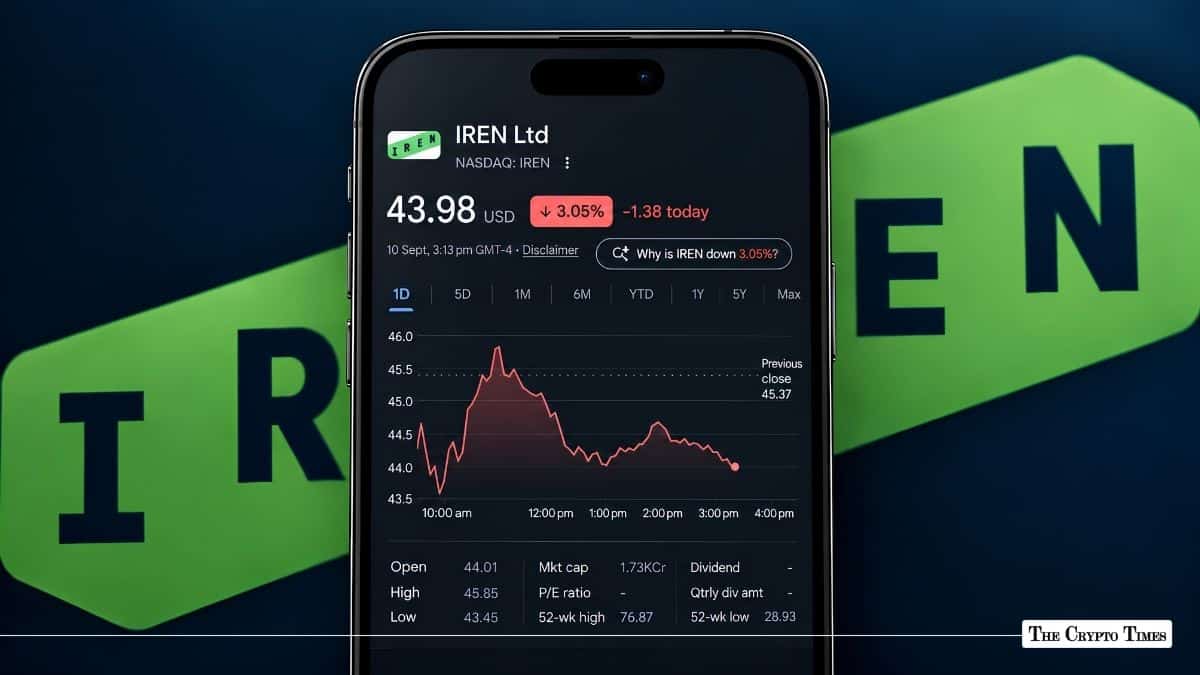
- IREN traded at $44.26 at 17:14 UTC on September 10, after moving between an intraday low of $43.39 and a high of $45.84.
- The stock faces resistance around its $45.65 200-day SMA, followed by the September high of $49.29, while the 50-day SMA near $40.21 provides an important support area.
- A September base case puts IREN between $40 and $50, while a confirmed breakout above $50 could open a move toward the $52–$58 range.
IREN Ltd. (NASDAQ: IREN) has recovered sharply in September after its post-earnings decline in late August, bringing the stock back within reach of the psychologically important $50 level.
As of 17:14 UTC on September 10, IREN traded at $44.26, down about 2.4% on the session. The stock recorded an intraday high of $45.84 and low of $43.39. It remains roughly 20% above its September 1 close of $36.82, although it has pulled back from the September 8 monthly high of $49.29.
IREN Price Rebound Runs Into $45–$50 Resistance
IREN began September at $36.82 before climbing to $39.60 on September 2, $41.65 on September 3 and $44.68 on September 4. The rally accelerated on September 8, when IREN reached an intraday high of $49.29 before closing at $46.93.
The stock subsequently failed to hold the breakout. It closed September 9 at $45.37, down 3.32%, before slipping to $44.26 during Thursday’s session. That makes the $45.50–$47.30 area the first resistance zone that buyers need to reclaim, followed by September’s $49.29 high.
The broader technical structure remains mixed rather than outright bullish. S&P Global Market Intelligence data puts IREN’s 50-day moving average at $40.21 and 200-day moving average at $45.65, while its 14-day RSI stands around 57, indicating positive but not overbought momentum.
IREN therefore sits above its shorter-term trend support but around or below the 200-day average following Thursday’s decline. A return above $45.65, followed by a break of $49.29, would provide stronger confirmation that September’s rally is continuing.
What Could Push IREN Above $50?
The fundamental catalyst remains IREN’s rapidly expanding AI Cloud business.
IREN said in its August 27 results that it had approximately $4 billion of contracted annualized run-rate revenue for 2026 capacity, with around $1 billion already operating as of August 26. The company said its 2026 capacity was largely sold out and that it was in late-stage discussions covering a significant portion of its planned 2027 capacity.
The company has also delivered the first 50MW Horizon deployment to Microsoft, while Horizon 2 is being commissioned and Horizon 3 and 4 are targeting delivery during the fourth quarter of 2026. Its planned infrastructure pipeline extends beyond 5GW across North America, Europe and APAC.
IREN’s relationship with NVIDIA provides another major part of the valuation story. In May, the company disclosed a five-year, $3.4 billion AI Cloud contract with NVIDIA and a broader 5GW strategic partnership. NVIDIA also received the right to purchase up to 30 million IREN shares at $70 each, subject to conditions.
Those contracts help explain why IREN is increasingly valued as an AI-infrastructure company rather than solely as a Bitcoin miner.
But IREN’s Valuation Still Carries Significant Risk
The transition is far from complete.
IREN generated $707 million in FY2026 revenue, including $578.2 million from Bitcoin mining and only $128.8 million from AI Cloud Services. The company posted a $702.6 million net loss, although much of that reflected non-cash impairment charges related to retiring Bitcoin-mining hardware as facilities are converted for AI workloads. Adjusted EBITDA was $245.7 million.
IREN’s own SEC disclosures identify several risks around its expansion, including large capital requirements, customer concentration, construction delays, GPU availability and obsolescence, financing costs and the ability to deliver contracted capacity on schedule.
Dilution is another factor worth watching. IREN had approximately 394 million shares outstanding, up 41.6% from a year earlier, according to S&P Global Market Intelligence. Short interest is also elevated at roughly 27% of the float, while the stock’s five-year beta stands at 4.28. Those figures help explain why IREN can move sharply in either direction.
Fed Decision Could Decide IREN’s September Direction
Macro conditions may be the most important near-term variable.
U.S. producer prices increased 0.4% month-over-month and 5.4% year-over-year in August, according to data released September 10. Following the report, market pricing moved toward roughly a 70% probability of a 25-basis-point Federal Reserve hike at the September meeting.
The U.S. 10-year Treasury yield also moved close to 4.9%. High yields generally create a tougher valuation environment for high-growth companies whose expected earnings are concentrated further into the future, making IREN particularly sensitive given the amount of future AI capacity currently embedded in expectations.
The next major checkpoints are the August CPI report on September 11 and the September 15–16 Federal Reserve meeting. A cooler inflation reading or a less hawkish Fed outcome could improve the environment for AI and growth stocks; another inflation surprise could produce the opposite reaction.
IREN Stock Price Prediction for September 2026
| Scenario | September range | What would support it |
|---|---|---|
| Bearish | $35–$40 | Break below $40–$41, higher yields, hawkish Fed, broader AI selloff |
| Base case | $40–$50 | 50-day support holds and IREN consolidates after September rally |
| Bullish | $50–$58 | Break above $49.29–$50 with improving growth-stock sentiment |
| High-volatility extension | $58–$60+ | Strong AI catalyst combined with a broader risk-on rally |
The $40–$41 area is currently the most important support zone. It combines the September 4 low near $41 with the 50-day moving average around $40.21. Below that, the September 2–3 region around $39 becomes important, followed by the month’s $35.14 low.
On the upside, IREN first needs to recover approximately $45.65–$47.30. The bigger confirmation would be a sustained move above $49.29, which would clear September’s high and make the psychological $50 level support rather than resistance.
What Are Analysts Predicting for IREN Stock?
Wall Street remains considerably more optimistic over a longer time horizon, but analyst price targets should not be treated as September forecasts.
The current average target across 17 analysts is approximately $77.84, according to S&P Global Market Intelligence data.
Among recent analyst actions, BTIG maintained an $80 target on September 2, while Freedom Capital Markets maintained a $58 target. Macquarie carried a $90 target, Canaccord Genuity $79, Cantor Fitzgerald $99 and H.C. Wainwright $90 following IREN’s August results.
Bernstein has separately maintained a $100 12-month target on IREN. The Crypto Times previously examined what would be required for the stock to reach that valuation. Can IREN Stock Hit $100 in 2026?
Those targets cover approximately 12 months rather than the remaining weeks of September, making the stock’s current support and resistance structure more relevant for a near-term forecast.
Can IREN Reach $50 in September?
$50 is achievable during September, but the chart has not confirmed that breakout yet. IREN already traded as high as $49.29 on September 8, so reaching $50 requires only a relatively small move from the month’s existing high.
The stronger signal would be IREN holding above $49.29–$50 after breaking it, rather than briefly touching the level. Until then, a $40–$50 September range remains the more defensible base case, with approximately $45–$49 as a reasonable month-end zone based on the current price structure.
The bullish scenario strengthens above $50 and weakens materially if IREN loses the $40–$41 support cluster. Given IREN’s high beta, elevated short interest, ongoing AI-capacity buildout and the September Fed decision, considerably wider intramonth swings remain possible.
Also Read: XMR Price Prediction for September 2026: Can Monero Clear $550?



![trade[XYZ] Launches Event Contracts on Hyperliquid Using HIP-4](https://www.cryptotimes.io/wp-content/uploads/2026/09/TradeXYZ-Launches-Events-on-Hyperliquid-for-Prediction-Markets--420x280.jpg)