Bitcoin surged past the $75,000 mark on Friday, August 21, 2026, marking its highest level in the past few months and extending a powerful recovery that has lifted the cryptocurrency more than 20% in a day.
At the time of publishing (6:00 AM UTC), the digital asset traded around $75,300 with a 24 hour trading volume of $60 billion, as per CoinGecko data.
The breakthrough came on the back of a multi-day rally that began earlier in the week. On August 19, Bitcoin climbed from the mid-$64,000 range to nearly $70,000. Momentum accelerated on August 20, pushing prices through $72,000 and $73,000 before the final leg higher into Friday.
Although Bitcoin is still roughly 40% below its all-time high of approximately $126,198, which was recorded on October 6, 2025. Despite the distance from the peak, the rebound has restored a measure of optimism after a difficult first half of 2026 that saw the price dip as low as the high $50,000s to low $60,000s.
TradingView data shows that year-to-date (YTD), Bitcoin remains down in the mid-teens to low-20% range depending on the exact starting point, yet the latest price action has shifted short-term technical pictures firmly into recovery mode.
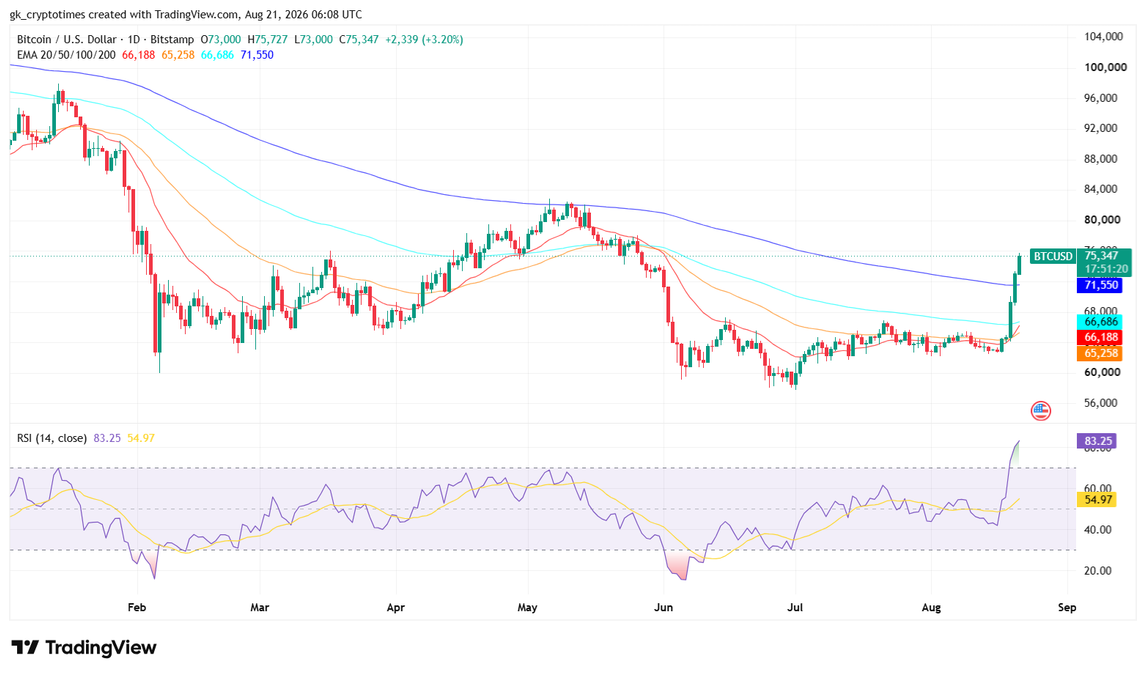
The chart shows that Bitcoin successfully defended a key demand zone near $62,000 earlier in August, forming a series of higher lows before breaking above the $67,000-$68,000 resistance area. The subsequent push through $70,000 opened the door to the current levels.
Analysts monitoring chart patterns noted that a sustained hold above $70,000–$70,300 would strengthen the case for further upside toward $76,000 and potentially the $80,000–$82,000 zones.
Broader Cycle Context and Historical Perspective
The current price sits within the larger post-halving cycle that began after the April 2024 reward reduction. Bitcoin’s fourth halving occurred when the price was near $64,000. That event, combined with the approval of U.S. spot Bitcoin exchange-traded products (ETPs) earlier in 2024, fueled a powerful bull run that carried the asset through $100,000 by late 2024 and ultimately to the October 2025 peak.
The subsequent correction through the end of 2025 and into 2026 followed familiar patterns of multi-month consolidations and drawdowns that have characterized previous cycles, though the peak-to-trough decline so far has been milder than the 70–85% drops seen in earlier bear markets.
Long-term holders and on-chain metrics have drawn attention during the recent rebound. Aggregate realized price levels and long-term holder cost bases have clustered in the $50,000 region, providing a structural floor according to some research.
The average annualized growth rate over the past decade remains elevated, underscoring Bitcoin’s historical ability to recover from significant setbacks and establish new highs over multi-year horizons.
In the latest rally, liquidity conditions and macroeconomic signals also played a supporting role. Reports of increased U.S. Treasury buybacks and broader gains in risk assets coincided with the August advance, helping restore appetite for cryptocurrencies.
“The U.S. Treasury’s decision to increase long-term bond buybacks could influence liquidity and yield expectations, while renewed momentum around the CLARITY Act is adding to optimism around the broader regulatory environment for digital assets,” said Mr. Vikas Gupta, Country Manager – India, Bybit, in a statement shared with The Crypto Times.
“The speed of this rally also highlights how quickly liquidity and sentiment can influence crypto markets. While the breakout is encouraging, investors should be mindful that sharp moves can be accompanied by elevated volatility and short-term profit-taking. Rather than reacting to price momentum alone, investors should consider their risk appetite, position sizing and investment horizon,” Gupta further emphasized.
Analyst Views on the Path Ahead
Forecasts for the remainder of 2026 remain divergent. Some technical and on-chain analyses project a base-case year-end range of $55,000 to $75,000, with bullish scenarios extending toward $80,000–$105,000 if momentum continues.
More optimistic institutional targets, including those from major banks, still reference $100,000 as a possible endpoint for the year under favorable conditions. Longer-term projections into 2027 and beyond span an even wider spectrum, reflecting the inherent uncertainty of crypto markets.
“Going forward, sustained institutional participation, regulatory clarity, macroeconomic liquidity and continued adoption will be important factors in determining whether Bitcoin can build on these gains,” Gupta predicts. “The current move is significant, but investors should focus on the broader market fundamentals rather than treating a short-term rally as a guarantee of further price appreciation.”
Traders are now watching whether Bitcoin can convert the $70,000–$75,000 region into lasting support. Many believe failure to hold these levels could invite a retest of the mid-$60,000s, while a decisive break higher would open the door to the next resistance clusters.
Also read: Coinkite Updates COLDCARD After Seed Flaw Exposed Bitcoin Wallets