Key Highlights
- SHIB surged 6.69% in 24 hours to $0.000004969, with trading volume jumping 72.57%.
- Bullish technical indicators, including MACD and moving averages, supported the rally.
- RSI remained neutral at 61.53, suggesting further upside may still be possible if momentum holds.
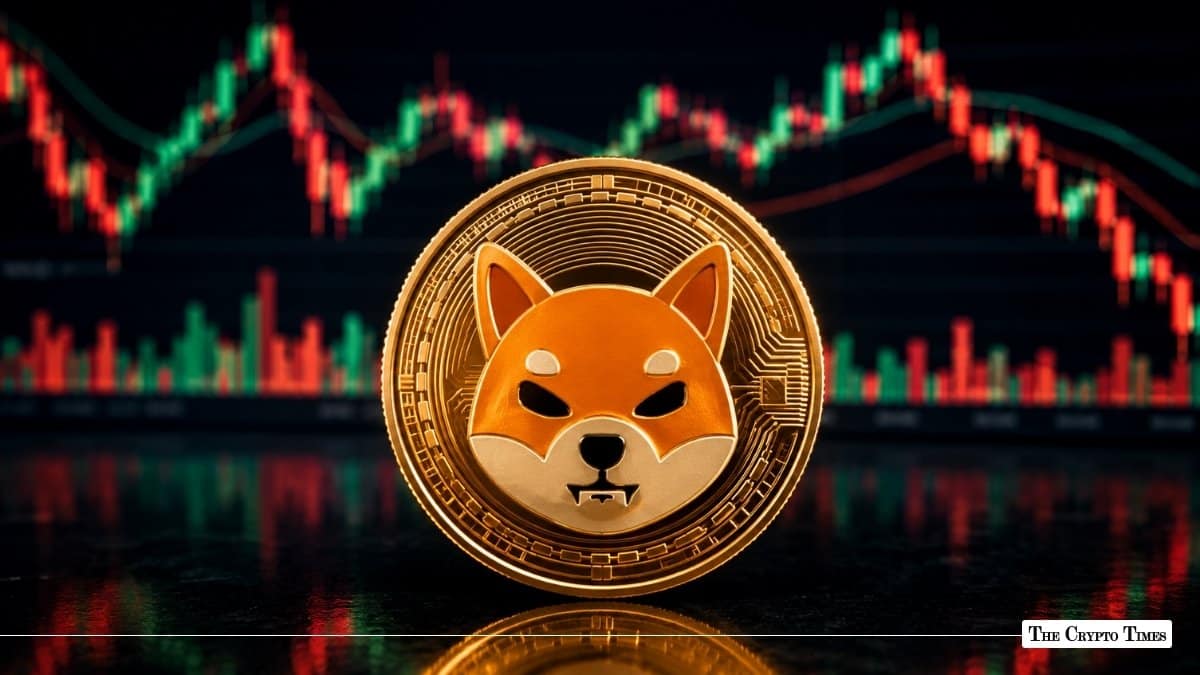
Shiba Inu (SHIB) has shown upward momentum, surging 6.69% in the last 24 hours to trade at $0.000004969 with a market capitalization of approximately $2.92 billion. This marks a notable recovery and bullish momentum in the short term.
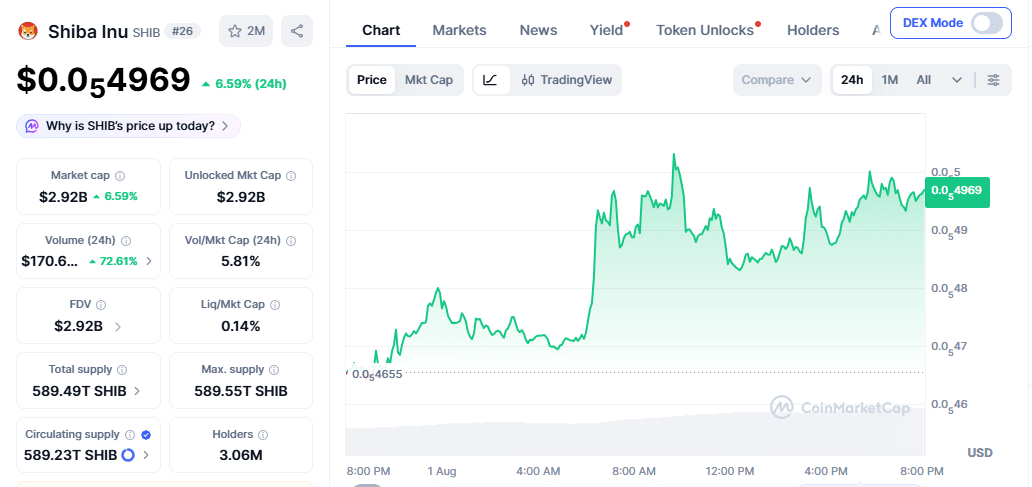
The one-day chart shows a clear upward trend, with SHIB rallying from around $0.0000046 to an intraday high near $0.000005053 before consolidating around $0.000004969. Trading volume rose to $170.6 million, up 72.57% over the past 24 hours, indicating stronger market participation during the rally.
Why is SHIB token up?
The surge appears driven by a combination of positive on-chain signals and broader market sentiment. On July 22, reports emerged that investors pulled a massive 62.1 billion SHIB tokens from centralized exchanges in just 24 hours, a strong bullish indicator suggesting accumulation and reduced selling pressure.
Reduced exchange supply often precedes price rallies as holders move tokens to private wallets for long-term storage. Additionally, SHIB’s climb back into the top 30 cryptocurrencies by market capitalization (now #26) has likely attracted fresh attention and FOMO buying. High trading volume and favorable technicals further amplified the move amid a recovering meme coin sector.
Technical indicators support bullish momentum
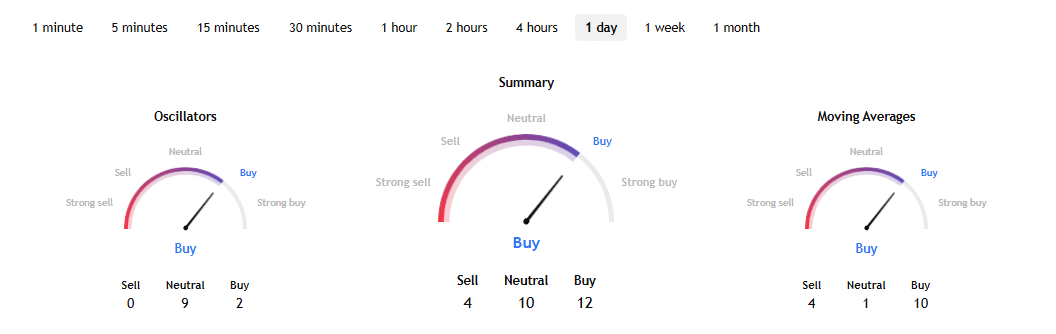
Technical indicators largely support the bullish narrative. The summary gauges show a Buy signal across Oscillators and Moving Averages. Momentum (10) and MACD Level (12, 26) are flashing Buy signals, while most Exponential and Simple Moving Averages (10 to 50 periods) are also in Buy territory.
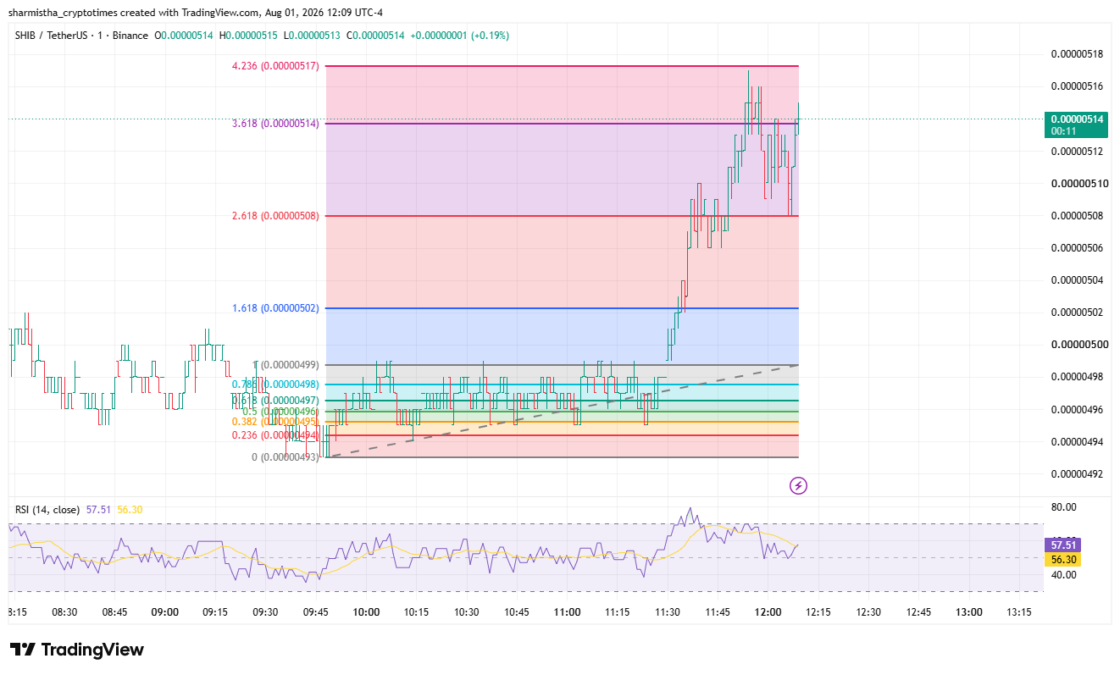
The Relative Strength Index (RSI 14) sits at a neutral 57.51, suggesting the rally still has room to run without being overbought. If SHIB maintains the same upward momentum, it could witness resistances R1 at $0.00000514 and R2 at $0.00000517. On the contrary side, support zones S1 and S2 remain at $0.00000508 and $0.00000502, respectively.
On the weekly timeframe, SHIB shows even stronger performance with 12.89% gains, reflecting sustained upward momentum over the past seven days. The token has broken out of a multi-day consolidation phase, with the chart forming higher highs and higher lows.
Despite the recent gains, SHIB remains about 94.38% below its all-time high of $0.00008845, reached in October 2021.
Risks remain despite the rally
Despite the 6.69% daily gain, SHIB remains a highly volatile asset and is still down more than 94% from its all-time high.
Although exchange outflows are generally viewed as constructive, they do not guarantee continued price appreciation. Longer-term moving averages, including the 100- and 200-period indicators, remain less supportive than shorter-term trends.
Without sustained ecosystem growth or stronger token-burning activity, SHIB could struggle to maintain its current momentum if broader market conditions weaken.
Also Read: Bitcoin Price Watch: Lower $60,000s Range Holds Amid Security Concerns