Bitcoin has surged back above the psychologically important $65,000 level, injecting fresh optimism into cryptocurrency markets that have endured weeks of consolidation and volatility. As of July 21, 2026, BTC trades in the $65,200–$65,500 range, marking a roughly 2.4% gain in the past 24 hours and extending its July recovery.
This move comes amid renewed spot Bitcoin ETF inflows, easing geopolitical tensions, and signs of institutional accumulation, signaling a potential shift in market sentiment.
The rebound represents a notable turnaround. Just weeks earlier, Bitcoin dipped toward $58,000–$62,000 amid outflows from U.S. spot ETFs and broader risk-off sentiment. Now, with a market capitalization hovering near $1.30–$1.31 trillion, the leading cryptocurrency has reclaimed key short-term resistance and is testing levels not consistently held since mid-June.
Drivers of the Rebound: ETF Inflows and Geopolitical Relief
The latest push in Bitcoin price follows several converging factors and chief among them is the return of inflows to U.S. spot Bitcoin ETFs. After eight consecutive weeks of outflows totaling billions, the funds recorded net positive flows in recent sessions—approximately $75.7 million in the past week and nearly $227 million on Monday July 21, 2026.
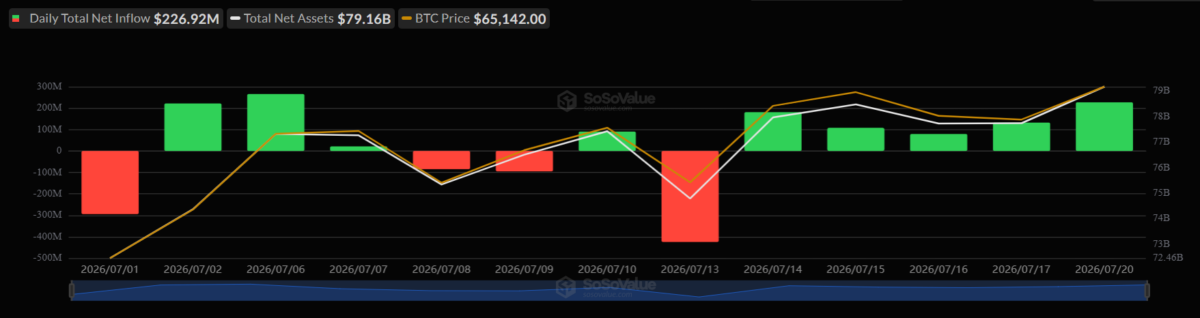
BlackRock’s IBIT and other major products led the charge, reflecting renewed institutional appetite. This reversal, though modest compared to earlier 2025 peaks, has helped stabilize prices and rebuild confidence. Bloomberg Intelligence’s Eric Balchunas noted parallels to gold ETF patterns, suggesting these inflows could mark the start of a steadier recovery phase.
Geopolitical developments have also provided meaningful support. Reports of potential resumed U.S.-Iran talks have eased tensions in the Middle East, reducing safe-haven demand for traditional assets and encouraging risk-on trades across equities, commodities, and crypto. Bitcoin benefited directly, climbing alongside broader markets as oil prices stabilized and investor nerves calmed. This de-escalation added billions to the total crypto market capitalization in short order.
“Bitcoin’s move above $65,000 is being driven by a combination of improving macro conditions and resilient institutional demand,” says Vikas Gupta, Country Manager – India, Bybit, in an exclusive statement shared with The Crypto Times. “Recent U.S. spot Bitcoin ETFs have returned to positive territory, recording approximately $181 million in net inflows following the latest U.S. inflation data, with another $227 million in inflows reported the following trading day, highlighting that institutional interest remains intact.”
Technical Outlook and Remaining Challenges
Technically, the breakout above $64,000–$65,000 resistance appears constructive. Bitcoin maintains a higher-low structure on daily charts and is trading above its 50-day simple moving average near $63,000.
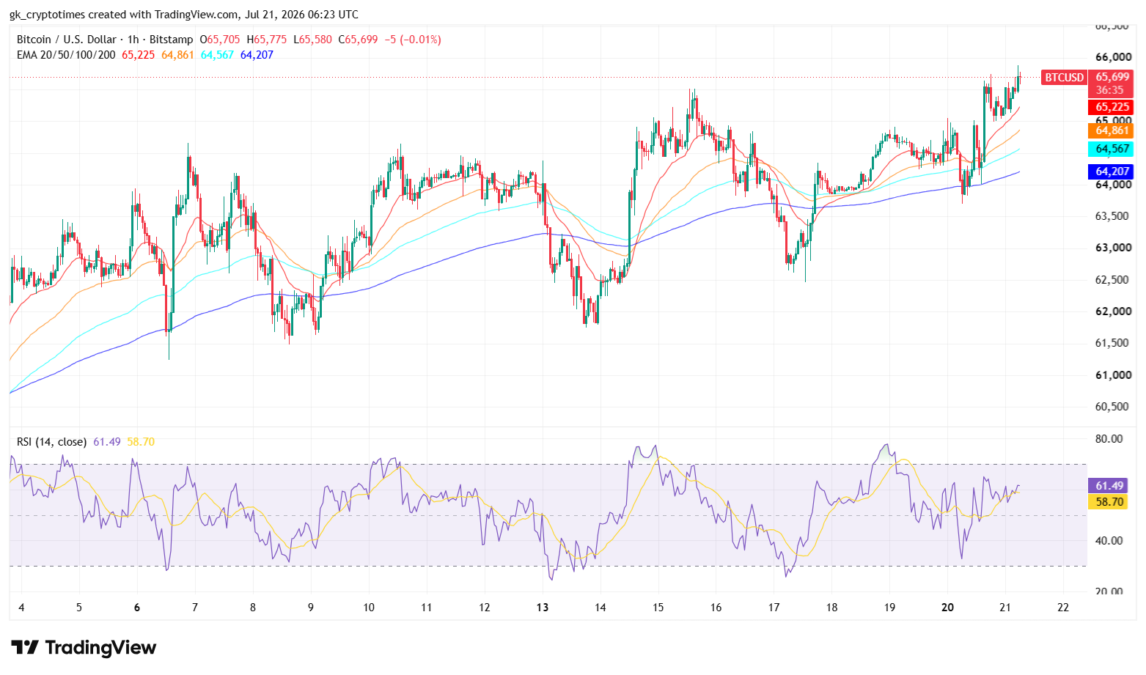
The 1-hour Bitcoin chart shows a strong bullish structure with price holding firmly above all major EMAs (20 at $65,225, 50 at $64,861, 100 at $64,567, and 200 at $64,207). BTC is currently trading near $65,700 after a volatile session that saw it spike toward $65,775 before a minor pullback.
The alignment of price above the EMAs, with the shorter-term ones acting as dynamic support during recent dips, indicates sustained short-term buying pressure. This setup follows a broader recovery from lower $60K levels earlier in July, with the current consolidation near $65K–$66K reflecting healthy digestion after the recent upside move. Volume appears supportive on the green candles, suggesting conviction behind the recovery.
The 14-period RSI sits at 61.49, comfortably in bullish territory but not yet overbought (well below 70). This leaves room for additional upside without immediate exhaustion signals. The RSI has been trending higher from recent oversold readings around the mid-July lows, confirming improving momentum.
For now, near-term resistance lies around the $66,000 psychological level and recent highs near $65,775–$66,000. A decisive break above this zone could target $66,500–$67,000 quickly. Support remains solid at the EMA cluster ($64,800–$65,200).
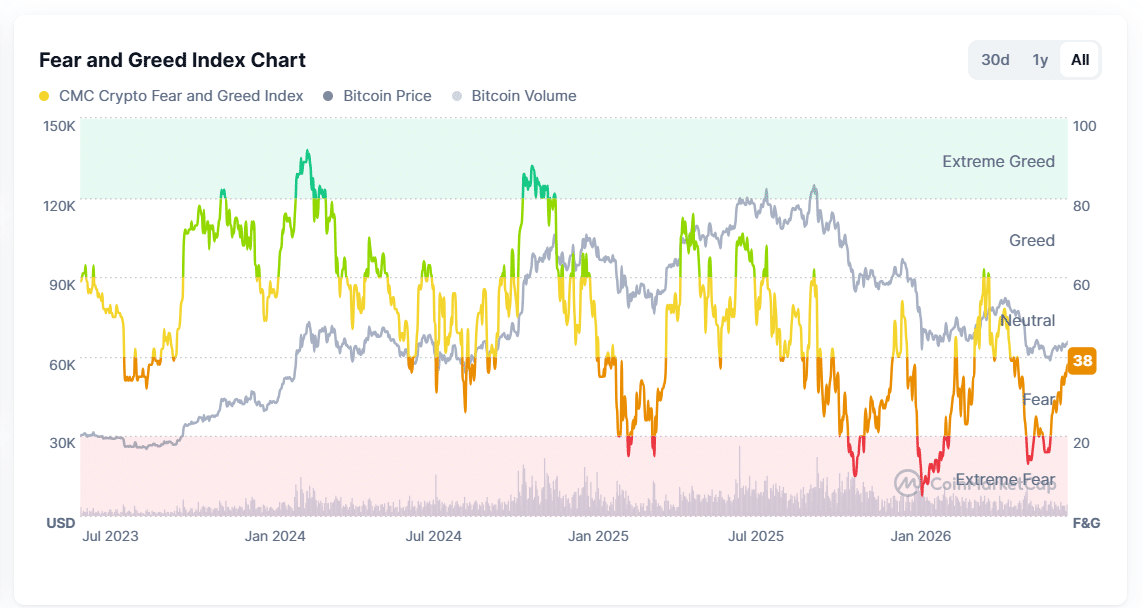
Despite the upbeat price action, caution persists. The Fear & Greed Index recently hovered near 29, indicating lingering investor wariness.
Institutional signals are mixed but improving. Corporate players continue strategic accumulation, and regulatory clarity efforts could provide further tailwinds. Seasonal patterns also favor July for Bitcoin, with historical data showing average positive returns—even in past bear markets. Yet some analysts characterize the current move as a bear-market relief rally rather than a definitive trend reversal. Sustained ETF inflows, stronger spot demand, and a decisive break above $67,000–$68,000 would significantly bolster the bullish case.
“As long-term institutional demand remains healthy, this structural supply-demand imbalance continues to support prices over the medium term,” Gupta noted further.
With this setup, market participants are now closely watching upcoming macroeconomic data on the FOMC, including U.S. inflation figures and Federal Reserve signals on interest rates.
Bitcoin’s reclaim of $65,000 encapsulates the market’s resilience. After defending $60,000 support and absorbing prior selling pressure, the asset is once again flashing signs of strength. Whether this evolves into a sustained uptrend or another consolidation phase will depend on continued institutional backing and macro tailwinds.
Also read: New Bitcoin Multisig Proposal Removes Need for Off-Chain Coordination