A leading Bitcoin investor and analyst has outlined a data-driven projection for the cryptocurrency’s next major market top, drawing on historical halving patterns.
Sunny Decree, a noted Bitcoin commentator and author, posted his analysis on X, estimating that the next significant price peak could arrive between April and October 2029. The forecast assumes the well-documented 12-to-18-month lag between Bitcoin halvings and cycle highs will hold for the upcoming cycle.
Decree’s view centers on Bitcoin’s programmed supply reduction events, known as halvings. These occur roughly every four years when the block reward for miners is cut in half, tightening new supply issuance. Historical data shows this scarcity shock has repeatedly fueled strong bull markets that culminate 12–18 months later.
With the next halving projected for around April 2028, applying the same timeframe points directly to the April–October 2029 window.
The prediction comes as Bitcoin trades in a post-2024-halving environment, with market participants closely watching whether established cycle rhythms will persist or shift due to structural changes in the ecosystem.
Historical Cycle Patterns and the Halving Effect
Bitcoin’s price history has shown remarkable consistency around halving events. The first halving in November 2012 was followed by a major top roughly 12–14 months later in late 2013. The July 2016 halving preceded the dramatic 2017 peak approximately 17 months afterward. The May 2020 halving led to the November 2021 all-time high about 18 months later.
The most recent halving in April 2024 has already produced significant gains, and many analysts continue to track similar timing for the current cycle’s eventual peak.
Decree highlights that these intervals, typically spanning 50 to 76 weeks in past cycles, align closely with the 12–18-month range. The pattern is not arbitrary. Halvings create a supply shock that reduces daily new Bitcoin issuance by 50%. This reduction, combined with steady or growing demand, historically leads to upward price pressure that builds over many months.
Market psychology amplifies the move as early awareness among sophisticated investors gives way to broader retail participation and media attention, often culminating in euphoric tops.
Supporting visuals shared alongside the analysis display Bitcoin’s long-term price chart with halving dates marked and vertical lines indicating the duration from each halving to subsequent peaks. The chart underscores how previous cycles produced outsized returns, although percentage gains have diminished with each successive cycle as the market has grown larger.
This diminishing-returns trend is widely acknowledged within the Bitcoin community and does not invalidate the timing aspect of the cycles.
Proponents of cycle theory argue that the underlying mechanics, programmed scarcity plus human behavioral patterns, remain powerful enough to sustain the 12–18-month post-halving window. Liquidity cycles, seasonal tendencies, and the four-year presidential election cycle in the United States have also been cited as reinforcing factors that align with Bitcoin’s rhythm.
Bitcoin Price Trajectory: From Post-Halving Surge to 2029 Outlook
Bitcoin’s price action since the April 2024 halving has closely mirrored historical post-halving patterns. After trading in a relatively subdued range for several months, the asset broke out dramatically in late 2024 and early 2025, culminating in a new all-time high of approximately $126,000 in October 2025.
This peak arrived roughly 18 months after the halving, aligning precisely with the upper end of the traditional 12–18 month cycle window observed in prior cycles. The rally was fueled by strong ETF inflows, corporate accumulation, and favorable macro conditions following the 2024 U.S. election.
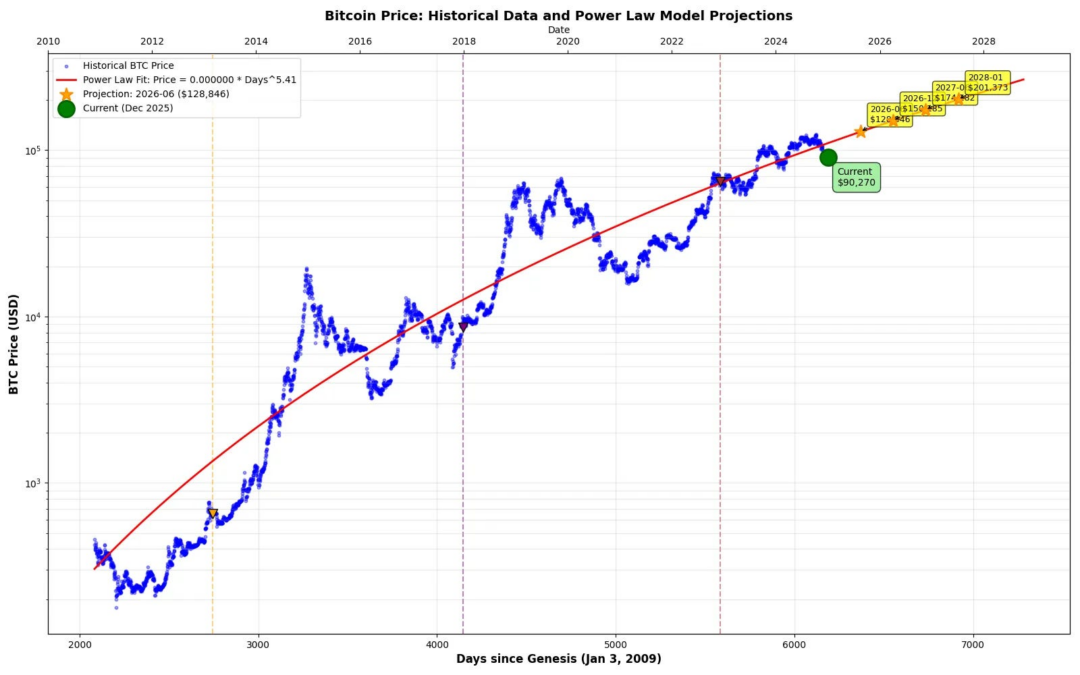
As of mid-2026, Bitcoin has entered a corrective phase, trading around the $62,700 range after pulling back more than 45% from its 2025 highs. This drawdown reflects typical cycle behavior, where euphoria gives way to profit-taking, reduced liquidity, and ETF outflows.
The pattern suggests the current cycle remains on track, positioning the next major bull leg and potential peak between April and October 2029, approximately 12–18 months after the anticipated 2028 halving. While institutional adoption may moderate volatility and returns, the core supply-shock mechanics continue to drive Bitcoin’s long-term upward trajectory.
Institutional Adoption, ETFs, and Potential Cycle Evolution
While historical patterns provide a clear framework, many observers question whether the market’s maturation will alter future timing. The approval and rapid growth of spot Bitcoin exchange-traded funds (ETFs) in 2024 introduced a new class of continuous, institutional-grade demand. Billions of dollars have flowed into these products, providing steady buying pressure that operates independently of retail hype cycles.
Corporate treasuries and potential sovereign adoption add further layers of demand. Large-scale holders tend to accumulate and hold rather than trade frequently, which could dampen sharp corrections or extend bull phases.
Some market participants believe these structural shifts may stretch the traditional cycle, potentially pushing the ultimate top into 2030 or beyond rather than the 2029 window suggested by past data.
The 2029 projection serves as a useful reference point rather than a precise forecast. It encourages disciplined portfolio management, regular accumulation strategies, and awareness that timing the exact top remains extremely difficult even for seasoned analysts.
As Bitcoin continues its evolution from niche asset to mainstream financial instrument, the interplay between supply mechanics and new demand channels will determine whether the classic cycle endures or transforms.
In the coming years, market observers will closely monitor ETF flows, on-chain metrics, and miner behavior for clues about whether the next top arrives on schedule or whether the cycle has indeed lengthened.
Also read: Democrats Slam Trump’s $500M UAE Crypto Deal: “National Security For Sale”