Bitcoin endured one of its most punishing weeks of 2026, dropping sharply from the low $70,000 range at the start of June to test lows near $59,000 before partially recovering to close around $63,000. This decline of roughly 20% in a matter of days underscores the persistent volatility in the cryptocurrency market, even as institutional adoption has deepened in recent years.
The sell-off was fueled by a confluence of factors. U.S. spot Bitcoin ETFs recorded massive outflows, with reports indicating over $4.4 billion withdrawn across a 13-day streak—one of the longest redemption runs since the products launched in early 2024.
Compounding the pressure, Strategy (formerly MicroStrategy), the largest corporate Bitcoin holder, disclosed its first BTC sale in years: 32 coins sold for approximately $2.5 million to cover preferred stock dividends. While the amount represented a tiny fraction of its holdings, the move carried symbolic weight and rattled sentiment.
Broader market dynamics also played a role, with reports indicating capital rotating into high-performing AI and technology stocks amid a risk-off environment influenced by macroeconomic uncertainties, including a resilient U.S. dollar and lingering inflation concerns.
Technical Analysis: Locked in a Descending Channel
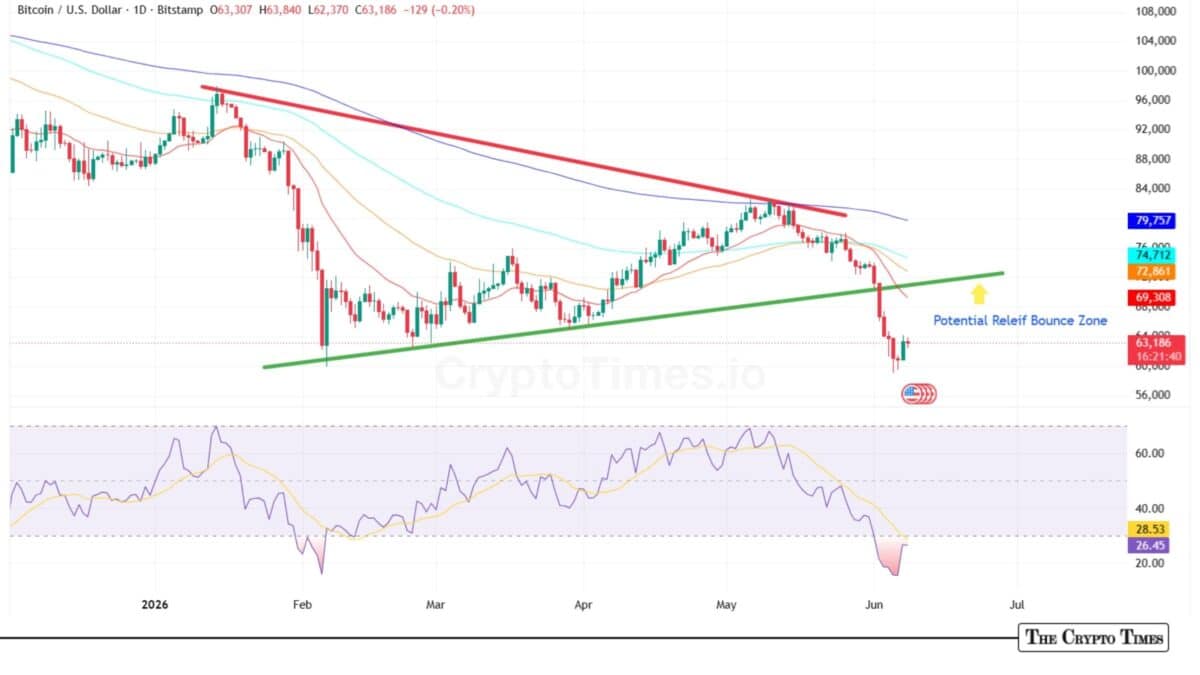
The daily chart paints a clear picture of sustained bearish control.
Bitcoin price remains trapped in a multi-month descending channel, characterized by consistent lower highs and lower lows since the early 2026 peaks near $100,000.
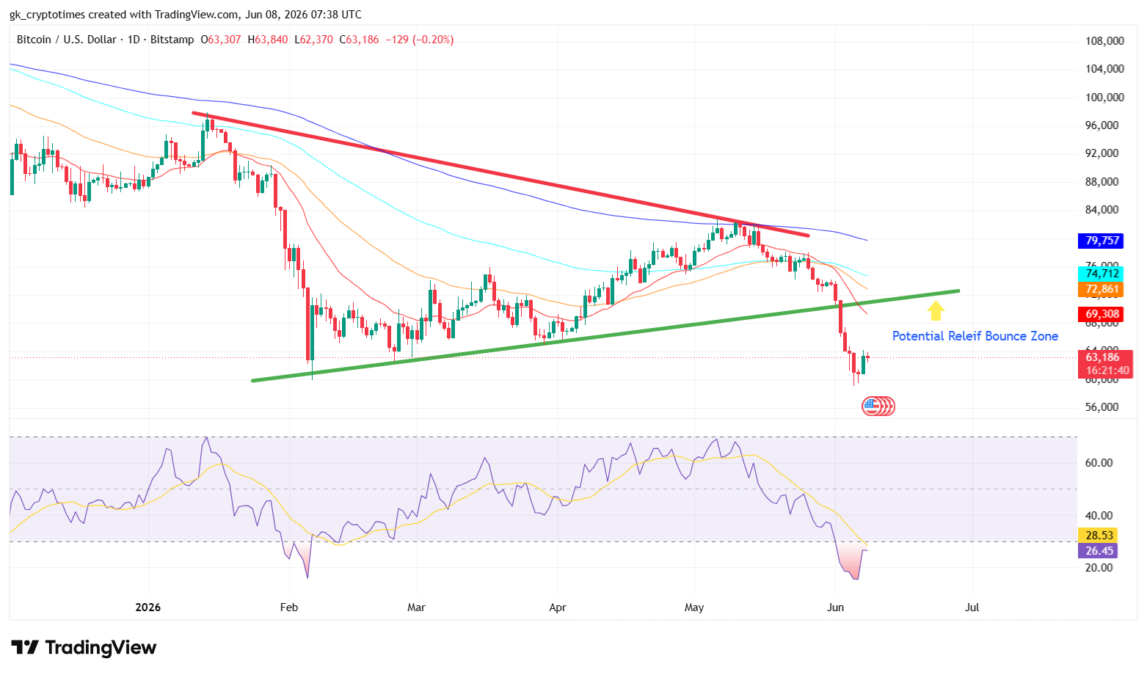
Key observations:
- Trendlines: A red descending resistance line connects early 2026 highs to recent lower highs at $80K, with price repeatedly rejecting attempts to break higher. A green ascending support line, from the March/April lows through the recent $59,000–$60,000 zone, would be now under active testing and represents a critical near-term pivot.
- Moving Averages: BTC is trading well below its 20-, 50-, 100-, and 200-day EMAs, reinforcing the dominant short-to-medium term downtrend. The 200-day EMA sits far above near $79,755, highlighting the depth of the current correction.
- RSI (14-period): Momentum indicators show deeply oversold conditions at 26.09. Such readings have frequently preceded short-term relief rallies in past cycles, although strong downtrends can keep the oscillator suppressed for extended periods.
Key Levels to Watch:
- Support: The psychological $60,000 zone and the 200-week moving average.
- Resistance: Immediate hurdles at $65,000–$66,000, followed by a denser cluster of EMAs between $69,000 and $75,000.
Cycle Context and On-Chain Signals
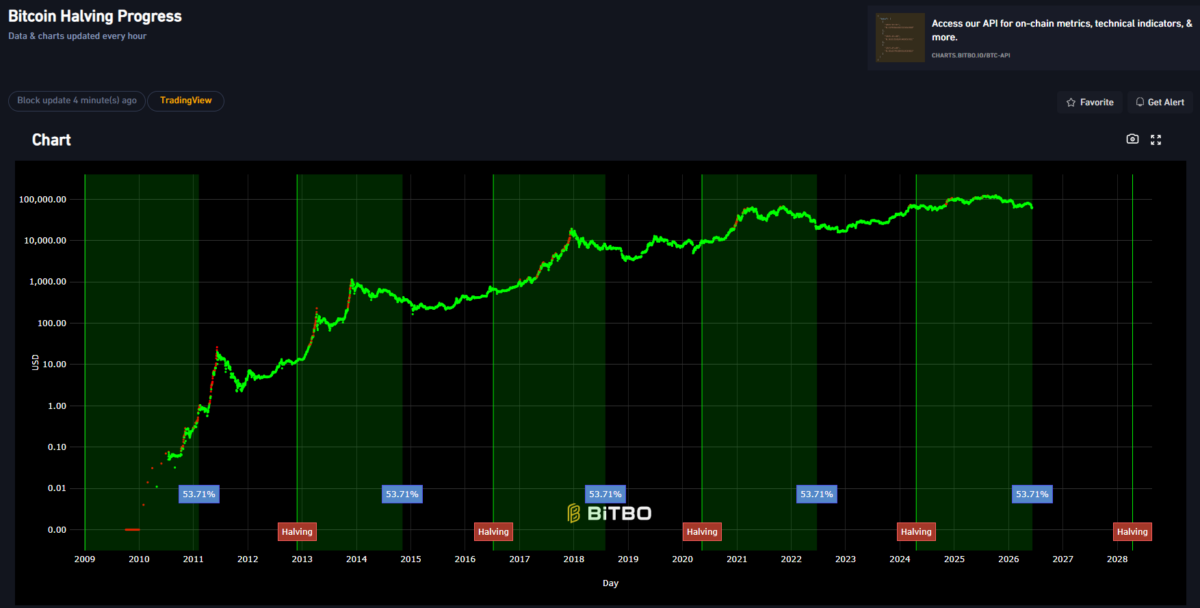
We are now more than two years into the post-April 2024 halving cycle. Historically, the strongest gains in Bitcoin’s four-year cycle have occurred in the 12–18 months following a halving, driven by reduced miner selling pressure and expanding institutional adoption.
The 2025 bull market followed this script, pushing Bitcoin to a new all-time high of $126,198 in October 2025 before entering the current corrective phase.
This cycle has shown signs of maturity and structural change. Gains since the 2024 halving have been more muted compared to prior cycles, reflecting Bitcoin’s evolution into a more established macro asset influenced heavily by ETF flows and institutional participation rather than pure retail speculation.
As of mid-2026, we are roughly halfway through the current halving epoch (next halving expected around April 2028), and many analysts anticipate the cycle low could materialize between June and December 2026—potentially setting the stage for the next major leg higher heading into 2027–2028.
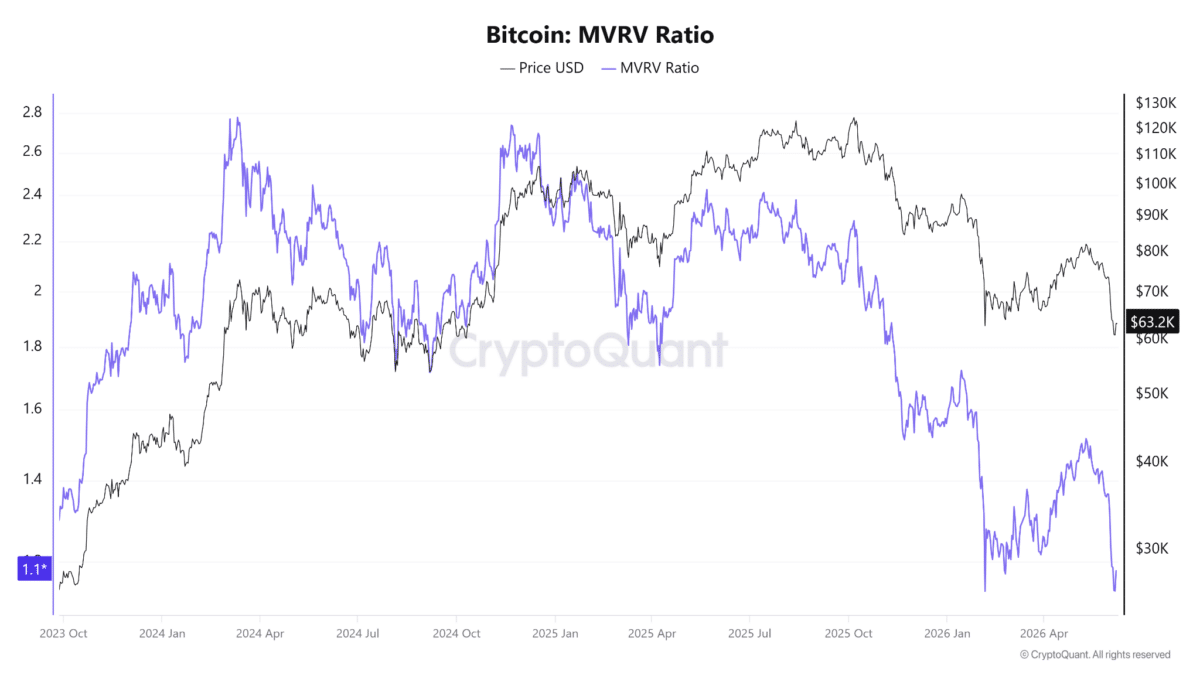
On-chain metrics provide additional context and suggest the correction is following a healthy reset pattern.
The MVRV (Market Value to Realized Value) ratio has declined meaningfully from elevated levels seen at the 2025 peak, indicating that unrealized profits are being flushed out and the market is moving toward more balanced valuations.
CryptoQuant data further shows that long-term holder (LTH) supply remains strong, with exchange balances continuing their multi-year decline as coins are moved into cold storage or institutional custody. This “diamond hands” behavior—where long-term investors refrain from selling during drawdowns—has been a consistent precursor to cycle bottoms in previous bear phases.
Additionally, the shrinking float of Bitcoin available on exchanges, combined with growing institutional holdings via ETFs and corporate treasuries, has altered supply dynamics.
While short-term volatility remains high, these on-chain signals point to underlying accumulation by strong hands rather than widespread distribution.
Sentiment Hits Extreme Fear
Market sentiment has deteriorated sharply, with the Crypto Fear & Greed Index plunging into Extreme Fear territory, currently hovering at 15. This marks a steep decline from last week’s Fear reading of around 29 and last month’s near-neutral 38, reflecting widespread capitulation among retail and leveraged participants.
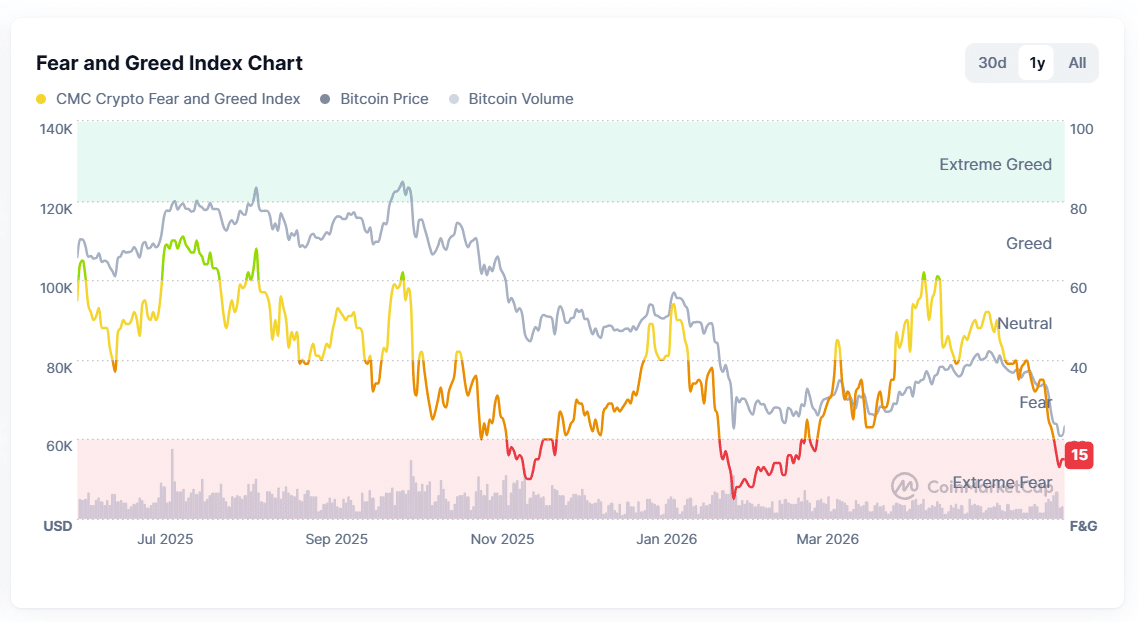
The index, which aggregates multiple data points including volatility, market momentum, social media sentiment, and trading volume, has a strong historical track record as a contrarian indicator.
Periods of Extreme Fear (readings below 25) have frequently coincided with local or cycle bottoms, offering attractive long-term entry points. For instance, similar low readings in prior cycles—such as 10-11 in early 2022 and mid-2021—were followed by significant recoveries in the subsequent weeks and months, with Bitcoin often delivering double-digit gains as selling pressure exhausted itself.
In February 2026, the index hit an all-time low of 5 during an earlier leg of the correction, preceding a partial recovery. The current reading of around 8 suggests that fear has reached near-panic levels again, with many investors washing out weak hands.
That said, sentiment alone does not guarantee an immediate bottom. In prolonged bear phases, the index can remain suppressed for weeks. Bitcoin’s increasing correlation with traditional risk assets means macro headwinds—such as a strong dollar and equity rotations—can prolong the fear phase. Still, the depth of current despair, combined with oversold technicals, echoes setups that have preceded strong rebounds in Bitcoin’s history.
What Lies Ahead?
For now, the near-term outlook remains obscure. A successful defense of the $60,000 support and the ascending trendline could trigger a relief rally toward $70,000, potentially retesting the EMAs. Conversely, a decisive breakdown below $59,000 might open the door to deeper support levels in the mid-$50,000s.
Longer term, many observers view the current environment as a standard mid-cycle reset rather than the start of a new bear market. Post-halving years have seen drawdowns of 30–50% or more before resuming upward trajectories. With Bitcoin still down substantially from 2025 peaks, patient investors may see this as another accumulation window.
As the market digests these developments, one thing is clear: volatility remains Bitcoin’s constant companion. Whether this week’s shakeout marks the final capitulation of the correction or merely another leg in an ongoing consolidation will depend on how price interacts with the key technical levels in the coming sessions.
Disclaimer: This content is for informational purposes only and is not financial advice. Trading cryptocurrencies carries significant risk of loss. Always do your own research and invest/trade responsibly.
Also read: New York Judge Halts Bid to Claim 39,000 Dormant Bitcoin Wallets