Key Highlights
- Sui Network reported a mainnet stall that may temporarily halt transactions.
- The SUI token fell sharply following the network issue and broader bearish sentiment.
- Technical indicators currently point toward continued downside pressure for SUI.
The Sui Network, a Layer 1 blockchain, is currently facing a network stall in its mainnet, while the SUI token witnessed a sharp decline of over 7% following the development.
According to the official update shared via X on Thursday, the issue may temporarily halt transaction processing across the network. The Sui Core team stated that it is working on a solution for this problem. However, the exact cause of this stall has yet to be disclosed, and delays can be expected until such time as the problem is sorted out.
SUI price drops over 7% in 24 hours
At the time of this writing, SUI was trading at around $0.9248, down around 7.1% in the past 24 hours and 16.36% in the last week, according to CoinMarketCap.
The 24-hour chart shows a downward trend that has been experienced throughout the day, with SUI declining from an intraday high of $0.9969 to the current value of about $0.9248. There have not been many efforts to recover the value of SUI since the price movement indicates consistent selling pressure.
The current market cap of Sui is $3.7 billion, while its FDV is $9.24 billion. Trading volume in the last 24 hours amounted to $769 million, and the circulating supply remains at 4 billion SUI.
Technical analysis paints a bearish picture
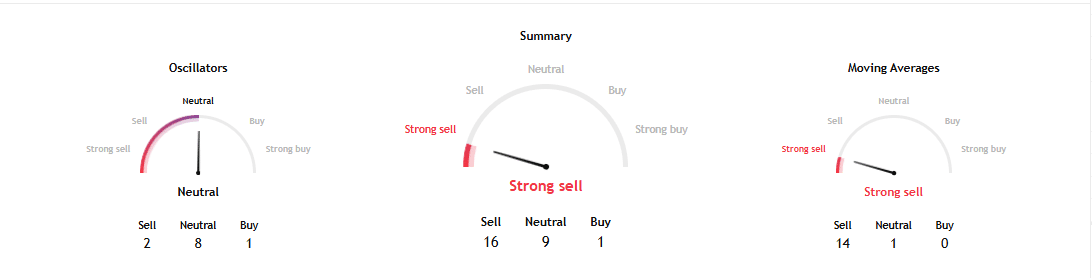
The technical analysis provides an overall bearish view in the near-term. The one-day technical chart posted on TradingView highlights a strong sell, where there are 16 sell signals, nine neutral, and one buy signal.
- Moving Averages: All the significant Exponential Moving Averages and Simple Moving Averages (10, 20, 30, 50, 100, and 200 periods) are signaling sell.
- Momentum Indicators: The MACD indicator highlights a sell, while Momentum (10) is negative.
- RSI (14): The current value of RSI is 38.3, which indicates that the asset is close to becoming oversold but has not yet reached its extreme.
- Other Oscillators: Stochastic, Commodity Channel Index, and Awesome Oscillator are mostly neutral and bearish.
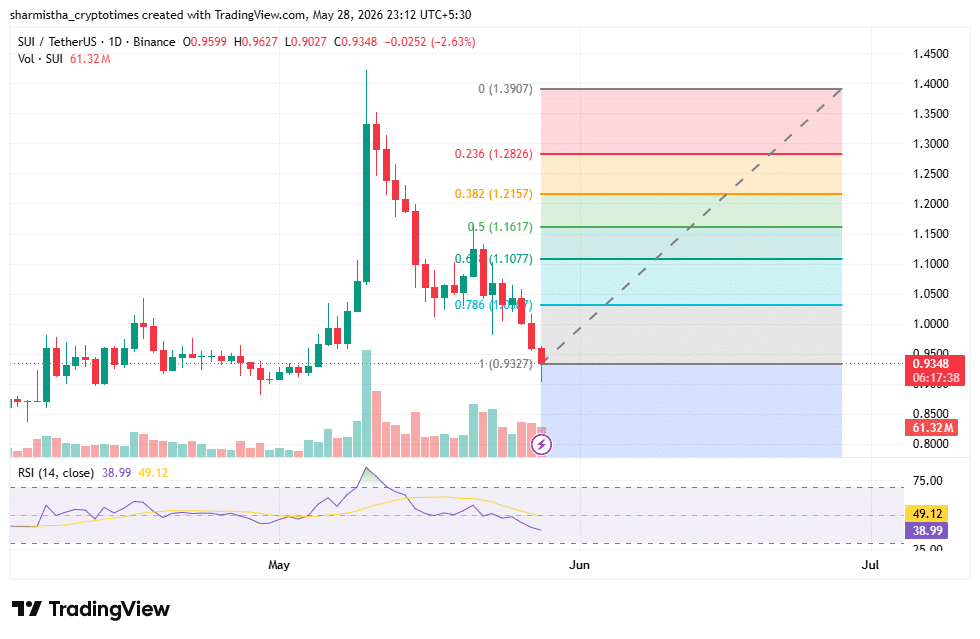
According to the one-day Fibonacci level analysis, there are certain levels of resistance that the token will be encountering going forward: The first Fibonacci level of resistance is $1.0082 (Fib R1). This will form the first resistance level if an attempt is made to bounce from the lows. A clean breakout from here will mark the beginning of a fresh bull leg.
The second Fibonacci resistance level is $1.0570 (Fib R2). This will form the next supply level, as there are high chances of sellers stepping in from here. The first significant support area that can be seen is from $0.85 to $0.80. As long as SUI trades higher than $0.8506, immediate risks will remain low. Any fall below $0.8018 will pave the way for a move towards $0.7230.
Before this, the token witnessed a major weekly surge on May 11, when the price showed around a 37% surge.
Challenging environment for SUI
The presence of both technical problems and the persistent halt in the network makes things difficult for SUI in the short term. Investors are advised to watch out for any news coming from the Sui Foundation on how they plan to resolve the matter of the mainnet.
Sui, in the long run, depends on the successful resolution of technical problems, the development of its ecosystem, and attracting developers and users amid other Layer 1 projects. In terms of market sentiment, there seems to be caution around SUI at this point.
Also Read: Kamino Brings Strategy’s Bitcoin-Linked STRCx to DeFi