
Key Highlights
- Stellar (XLM) jumped around 33% within 24 hours, reaching $0.1983.
- Trading volume surged over 1,100%, crossing $1.25 billion.
- Technical indicators signaled a strong bullish breakout after months of consolidation.
The Stellar (XLM) cryptocurrency has shown one of its strongest short-term rallies in a long while, climbing around 33% in the past 24 hours, pushing it to nearly $0.1983.
The spike has taken the cryptocurrency from the intraday lows of around $0.1461 to the current price and constitutes a clear bullish breakout with enormous volume and extremely bullish technical indicators.
According to the TradingView chart, the daily chart shows an impulse bullish candle that moves up vertically after the consolidation within the range of $0.14 – $0.16. With the intervention of buyers, the price moved up to hit multiple resistance points consecutively. The high on the day was marked at $0.1983, which is a 34.48% increase compared to its intraday low.
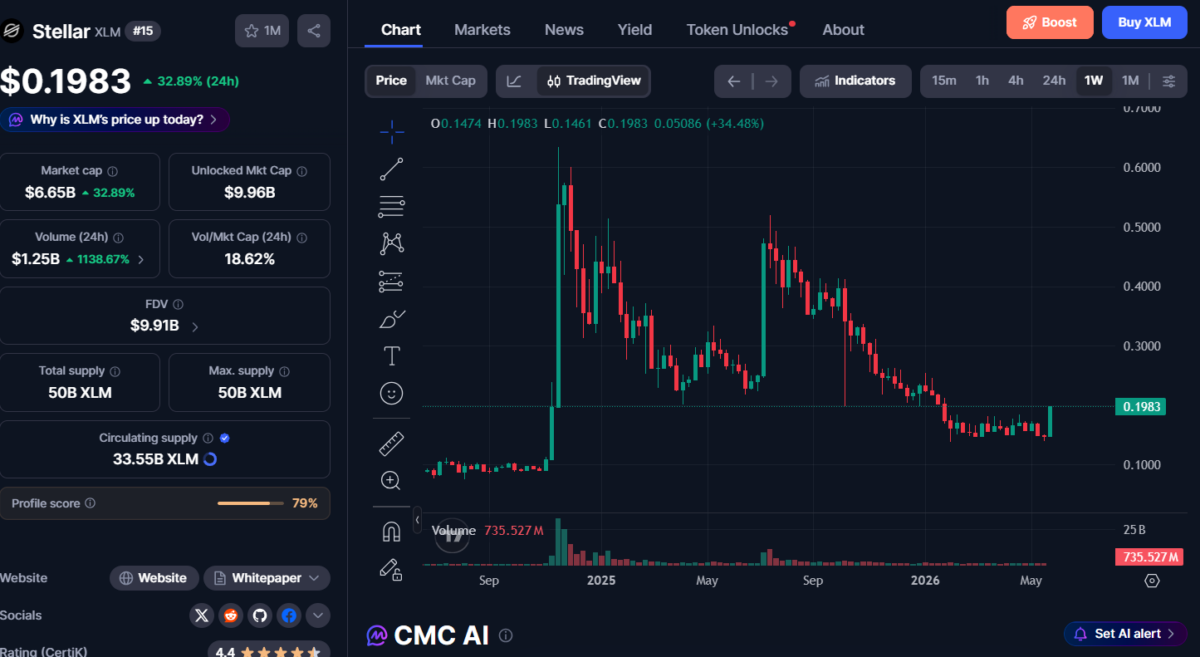
The chart also indicates that XLM is currently moving up from its bearish trend, which has been going on since early 2025. This move indicates that the currency has started forming higher highs, moving from distribution mode to accumulation mode.
However, the volume has increased substantially at this point, touching $1.25B in one day, representing over a 1,100% increase in trading activity compared to average sessions. The ratio of volume to market capitalization has risen over 20%. This shows the real interest in the stock market rather than a manipulative activity.
Fully diluted market capitalization is currently sitting around $9.9 billion, while the circulating supply is 33.55 billion of the 50 billion total.
Technical indicators provide case for bulls
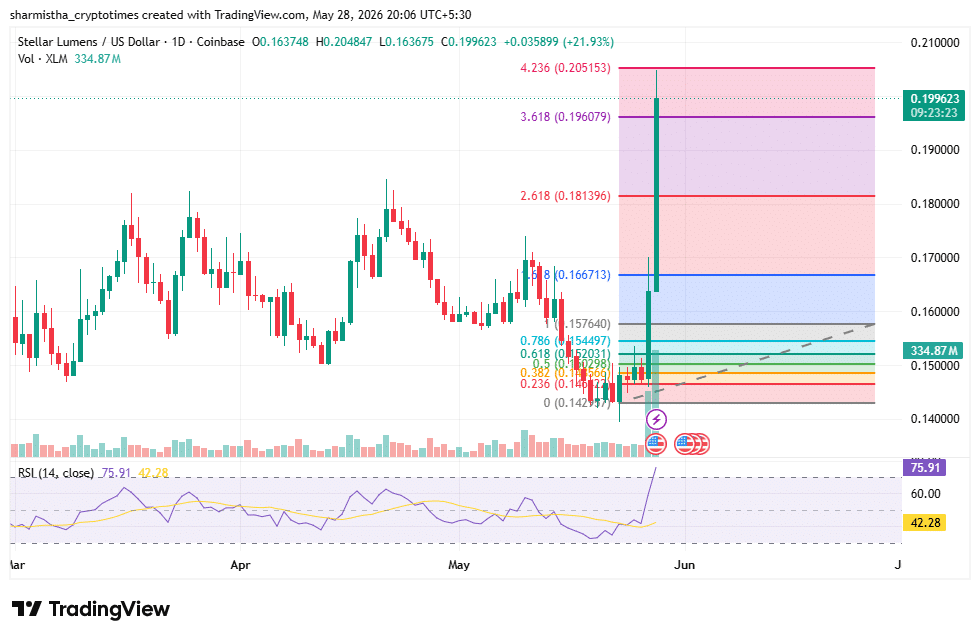
The technical picture strongly supports the bullish narrative:
- Moving Averages: Most EMAs and SMAs (10, 20, 30, 50, 100) are signaling buys. Price has made a strong break above the short EMAs, with the 50-period EMA providing support.
- Momentum Indicators: The MACD is bullish with an expanding histogram. Momentum (10) has gone into buy territory.
- RSI (14): At 75.9, suggesting strength in the market but not yet moving into extreme overbought levels (above 80–85).
- Other Indicators: StochRSI, Awesome Oscillator, and Bull/Bear Power are either neutral to bullish, with most exponential and SMA indicators pointing toward the bulls.
- Technical Summary Gauge: For the daily timeframe, the technical summary reads “Strong Buy,” showing a very biased ratio (15 buys vs. 1 sell).
On the one-day Fibonacci scale, the first resistance to XLM comes in the price area of $0.177563, which has already been crossed by the token today; the first support area remains at $0.151076.
DTCC partnership announcement fuels rally
The cause of the surge can be attributed to the Depository Trust & Clearing Corporation (DTCC) and Stellar Development Foundation jointly announcing their plans for tokenizing assets that will be stored in DTCC’s subsidiary, called The Depository Trust Company (DTC).
The initiative, announced on May 27, 2026, is an effort by DTCC toward its multi-chain approach for bridging traditional finance with DLT. Assets custodied by the DTC, such as highly liquid assets including stocks from the Russell 1000 index, major ETFs, and US Treasuries, are set to debut on the Stellar platform during the first half of 2027.
Traders advised to monitor thoroughly
The 33% rise on one day to $0.1983 in Stellar represents a crucial turn for the better technically as well as sentimentally. This rise, backed by surging volume, bullish signs across all indicators, and a decisive breakout above multi-month consolidation, is filled with conviction.
Traders should do their own analysis before trading in any tokens due to a sudden surge, as despite the trend being decidedly in favor of the bulls, the scope for volatility still resides in such tokens.
Also Read: Vitalik Buterin Reveals New Tools for Secure AI and Crypto Access