For seasoned Bitcoin traders, August carries a superstition: the “August Curse”, a pattern of underperformance and negative reuters. Since 2017, the month has more often delivered losses than gains, driven by reduced trading volumes and profit taking after rallies.
This year, the curse is already casting its shadow as Bitcoin’s record setting summer rally is under pressure as heavy whale liquidations, unprecedented ETF outflows, and renewed macroeconomic headwinds have pulled the BTC price towards the critical $111,000 support zone.
A Shaky Start to August 2025
Trading forums and crypto socials are filled with talks of the August curse. For some, the early drop combined with whale selling and ETF weakness confirms the superstition. Others argue that the market’s deeper liquidity and institutional base could make this year different.
The first week of August has shown traders the long lasting curse that bitcoin faces this month as after closing July at an all-time high (ATH), Bitcoin slipped below $115,00 in early August. As of August 6, BTC is hovering just above $111,000, which is a key level to hold.
Ethereum (ETH) has also pulled back to around $3670 after a record-breaking July for ETF inflows, while altcoins like Solana have been hit harder, with SOL down roughly 9% in the first week, according to CoinMarketCap.
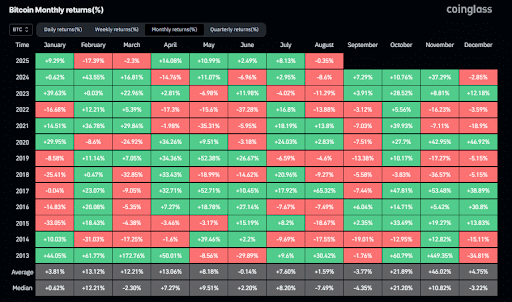
Moreover, historical data derived from coinglass supports the ‘August Curse’ theory. Last year, BTC price fell from a high of $65,587.9 at the start of the month to a low of $49,486.9 on August 5, marking an 8.7% drop. The month’s average price was $59,913.4 and showed a dramatic variance of more than $16,000 between the high point and the low point.
Robert Kiyosaki, author of the best-selling book Rich Dad Poor Dad also believes that the ‘Bitcoin August Curse’ could trigger a drop to $90K.
Despite the negative sentiment, on-chain and technical signals suggest buyers are stepping in–making the coming days a decisive test for market sentiments.
ETF Outflows Deepen as Profit-Taking Accelerates
U.S. spot Bitcoin ETFs posted their largest single-day redemption on record August 1, with $812 million withdrawn, according to SoSoValue. The week ending August 1 saw $643 million in net outflows, ending a seven-week streak of $10 billion in cumulative inflows.

Further, BlackRock’s iShares Bitcoin Trust (IBIT) has been a focal point, losing $292 million in August. Along with BlackRock, other ETF players such as Fidelity’s FBTC also witnessed massive outflows, suggesting that investors who entered during the early-year hype are now systematically taking profits off the table following July’s powerful rally. Month to date withdrawals for BTC ETFs have now surpassed $1.14 billion.
CryptoQuant analyst ArabaxChain noted, “ETF inflows were intermittent and not stable during periods when funds were withdrawn from ETFs. There was no alternative demand to compensate for this shortfall.”
Whale Watch: Dormant Coin Awakens and Move to Exchange
On-chain data reveals that the selling pressure is not just from new investors. The Exchange Whale Ratio remains stubbornly high above 0.70, indicating that large scale players are dominating exchange deposits.
Additionally, a long dormant Satoshi Era Bitcoin wallet suddenly became active in July, transferring more than $1.18 billion worth of Bitcoin to major exchanges like Binance, Bybit, Bitstamp, Coinbase, and OKX.
Exchange inflows have risen steadily since early July, with Binance alone overseeing 5300 BTC per day to over 7000 BTC per day.
More concerning is the rise in Coin Dormancy, a metric that tracks the average age of coins being spent. A spike in dormancy suggests that long-term Holders (LTHs) who have held their Bitcoin for years are beginning to move their coins to exchanges likely to sell.
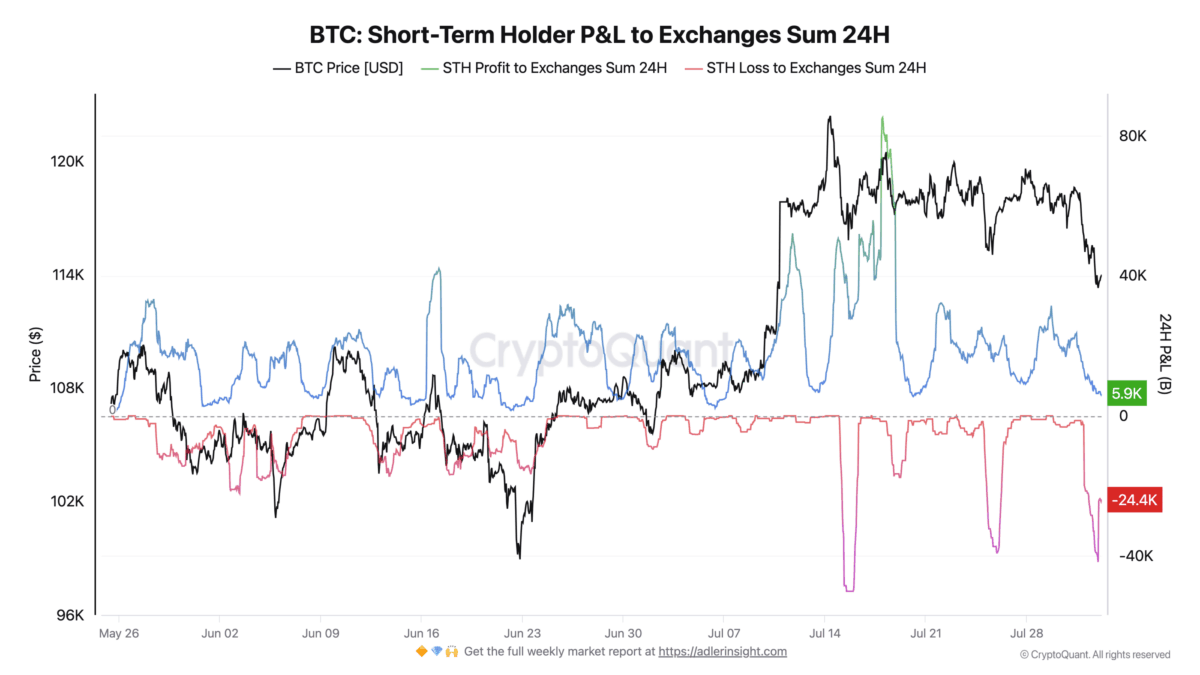
Moreover, on August 1, over 16,417 BTC flowed into exchanges, coinciding with data showing short term holders (STHs) capitulating by selling 40,000 BTC at a loss. The Short-Term Holders SOPR (Spent Output Profit Ratio) dipping below 1 confirms this, as it shows recent buyers are selling for less than they paid.
Time To Buy The Dip?
Despite the pullback, structural market conditions remain supportive of a longer-term uptrend. BTC’s July month close was the highest in its history. The recent drawdown appears more corrective than capitulatory. Regulatory clarity is improving, stablecoin integration is accelerating, and institutional tokenization initiatives continue to gain traction.
On-chain cost basis data suggest steady dip buying. Glassnode reports that the “airgap” between $109K and $116K is gradually being filled during price drops, forming a staircase pattern over the past month.
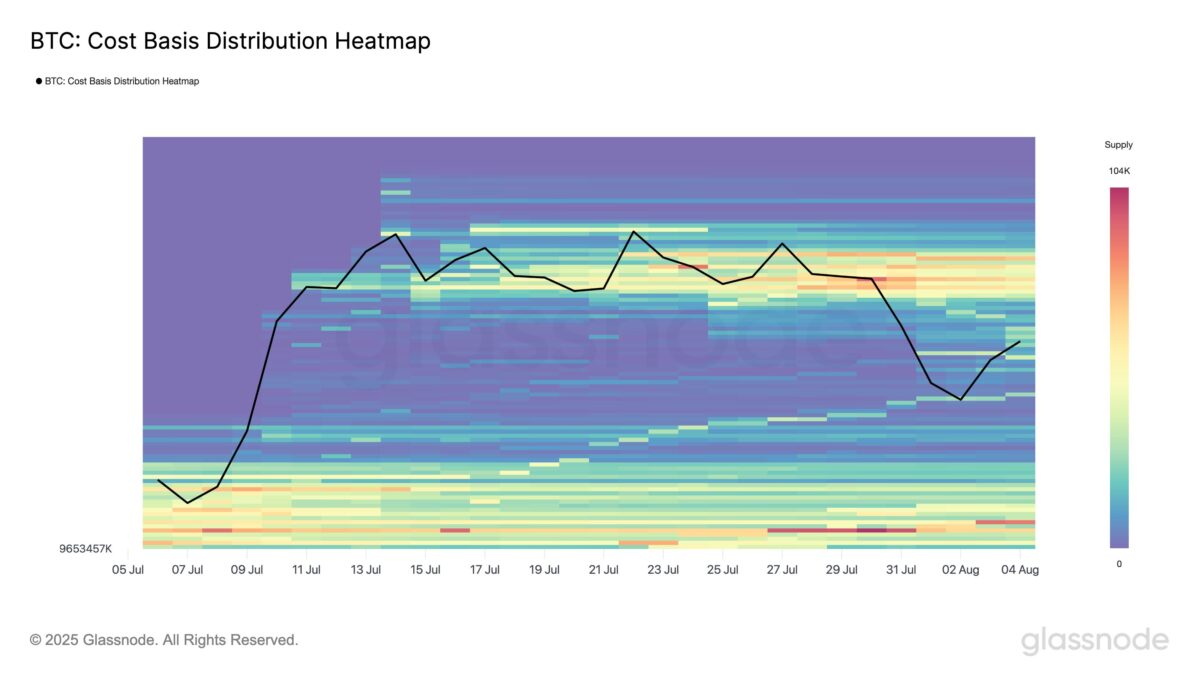
Importantly, there is limited distribution from the $118K-$120K range, suggesting that holders in this zone are choosing to hold through volatility rather than selling into weakness. In the derivatives markets, traders are already positioning for a rebound. They are targeting a rally above prior all-time high by buying August 29 call flys at $118K/$124K/$126K.
Digital Asset consultant QCP reports, “Spot levels near $112k warrant vigilance, especially amid persistent macro uncertainty. But signs of stabilization, such as renewed spot ETF inflows, declining implied vols and a narrowing of skew, would be constructive signals that institutional sentiment is recovering.”
Technical Picture: Retest and 50-Day MA Hold
BTC had a near perfect retest of previous high over the weekend and held above its 50 day moving average, a key technical line for medium term trend support. According to the CEO of Coinbuerue, Nic Pukrin, the setup is looking good ahead on the charts. This resilience combined with dip buying behavior, indicates underlying demand remains in play.
However, well known analyst, Ali Martinez identifies $111,000 as the most important short-term support. “If it breaks, the next key demand zone sits around $90,000, according to the Pricing Bands.”
He further noted that the last two times the weekly RSI dropped below the 14 SMA BTC, price corrected by 20% to 30%, and if history repeats, we could see a move down to $95,000.

What to Watch Next?
Key metrics to monitor for potential sentiment reversal include:
- A shift in net ETF outflows to net inflows
- Declining implied volatility levels
- Narrowing options skew towards neutrality
- The $111K level holding as support
If these metrics improve alongside continued dip buying, the sell-off could transition into a buy-the-dip opportunity rather than a prolonged correction.
Why Does It Matter?
The so-called August curse is more than a trading superstition; it’s a stress test for Bitcoin’s ability to hold momentum when seasonal weakness collides with real time market pressure. This year that test has been magnified by a rare alignment: record ETF redemption, aggressive whale distribution, and macro headwinds all hitting by the first week itself.
Whether BTC holds the $111K level or not will likely shape the rest of the month. A breakdown from here would confirm that institutional profit taking and whale selling have the power to push the price action towards the $90K demand zone. On the other hand, a strong defence by dip buyers could turn the current pullback towards the uncharted zone.
Also Read: Bitcoin Mining Difficulty Hits Record 127.6T, Slight Drop Expected
Disclaimer: This content is for informational purposes only and does not constitute financial advice. Crypto asset investments carry regulatory risk and may not be suitable for all jurisdictions.