
Ethereum traded near $2,572 on October 8, steadying after the prior session’s slide through $2,620.
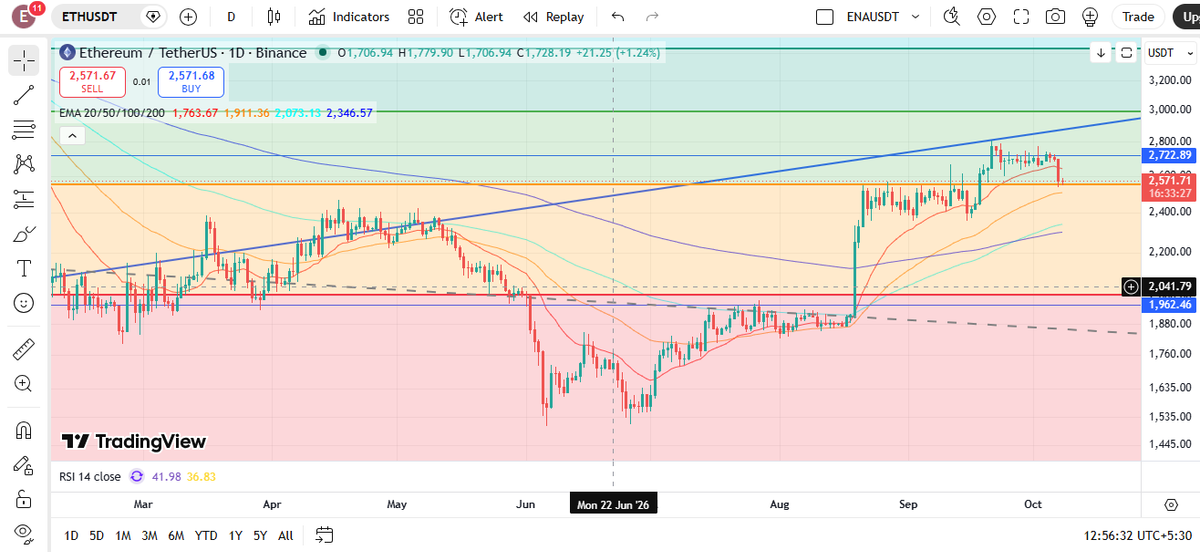
The Binance daily chart reviewed for this story marked the pair at $2,571.71, up 1.24% on that session. The right-hand scale also marked $2,722.89 above the last price and $2,041.79 and $1,962.46 below it. The session gain does not retrace the week. It puts Ethereum back to roughly where it was late on October 7, after a day that opened near the highs and closed near the lows.
The Crypto Times reported on October 7 that Ether was at $2,616.49, down 3.4% over 24 hours, with a range of $2,599.82 to $2,723.16. Market value then was about $319.57 billion. Twenty-four-hour volume was about $15.86 billion. The circulating supply was about 122.11 million ETH. Ether was also down 1.8% against bitcoin, at 0.03106 BTC. Later that day, in the BitMine note, Ether was at $2,561.23, down 5.9% at 15:06 UTC, after a low of $2,554.67 from a 24-hour high of $2,723.16. The October 8 print near $2,572 is a pause after that drop, not a reclaim of $2,700.
ETF Outflows and Liquidations
Two recorded flows hit the same window: a fifth straight ETF withdrawal and another long-heavy liquidation print.
U.S. spot Ethereum ETFs recorded a $160.9 million net outflow on October 7, according to the Farside Investors table reviewed for this story. BlackRock’s ETHA was the largest line, at $116.1 million, about 72% of the day’s total. Grayscale’s ETHE was $25.8 million. Smaller outflows showed at 21Shares ($6.3 million), Bitwise ($5.9 million), VanEck ($2.8 million), Grayscale’s mini fund ($2.0 million), and Invesco ($2.0 million). Fidelity, BlackRock’s staking fund, Franklin Templeton and Morgan Stanley were flat on that row.
That was the fifth straight withdrawal in October. Farside’s totals for the prior sessions were $201.9 million on October 6, $50.8 million on October 5, $37.4 million on October 2, and $55.4 million on October 1. The five sessions sum to about $506 million. The October 6 print was the heaviest day in that run and the only one above $200 million. The October 7 print was the second heaviest. The three sessions before those two were each under $60 million. The streak steepened, rather than running at one pace.
September’s table on the same Farside page shows the other side of the month: September 21 was a $270.0 million net inflow, September 22 was $182.2 million, and September 23 was $104.5 million. The month turned from large creations to a run of red totals after September 28.
A net outflow does not by itself set the price. It removes a buyer that had been present on inflow days. Shares redeemed in the primary market can lead an authorized participant to sell Ether or to sell less of it, depending on how the creation basket is hedged. The table does not show that hedge. It shows the direction of the fund flow.
CoinGlass’s Ethereum board, reviewed alongside the chart, showed $104,059,269 in liquidations, with $91,342,937 from longs and $12,716,331 from shorts. Longs were about 88% of that board. The largest single liquidation listed was $4,483,202. The peak hour was 15:30 to 16:30 UTC on October 7. The board said ether’s price volatility had exceeded 3.27% and that 6,937 traders were liquidated worldwide. The 24-hour rekt column matched the headline total, at $104.06 million. The 12-hour column was $17.03 million. The 4-hour column was $13.22 million. Most of the damage on that board was already behind in the last few hours.
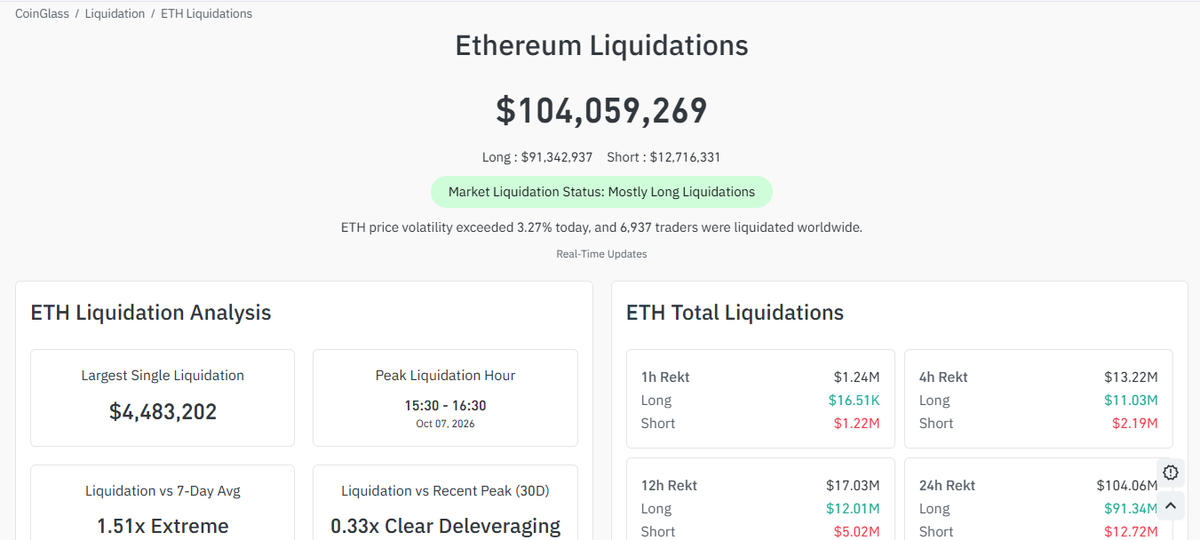
That $104 million is a smaller print than the $174.93 million, 94% longs, in the October 7 story. The two figures are different windows, not a revision of the same count. The earlier story also had ether leading bitcoin on the day, $174.93 million against $142.87 million, inside a crypto-wide liquidation total of $549.42 million. The later board does not repeat that cross-asset ranking. What it does repeat is the side: longs, not shorts, took most of the forced closes.
Open interest in ether perpetual futures was $47.50 billion in the October 7 story. A book of that size can turn a spot dip into a larger one when long positions are closed into the fall. The later CoinGlass board marked the print at 1.51 times the seven-day liquidation average and 0.33 times the 30-day peak. On those labels, the day was heavy against the recent week and light against the worst day of the past month.
Combined with the ETF withdrawals, the liquidation split leaves the spot market with less mechanical support under $2,600 than it had above $2,700 at the start of the week.
What the chart is showing
The daily chart places the spot near $2,572, under a marked level at $2,722.89 and above marked levels at $2,041.79 and $1,962.46. The relative strength index on the 14-period close was 41.98, with a second reading at 36.83. The relative strength index (RSI) measures recent price momentum on a scale of 0 to 100. The chart showed readings of 41.98 and 36.83. A reading in the low 40s is consistent with a bounce that has not reversed the prior day’s loss.
The moving-average labels on the chart sit below the last price. That placement means the session close was above those averages as drawn. It does not mean the averages are support that has been tested.
The levels that are dated, rather than drawn, are the ones from October 7. The high was $2,723.16. The low in the BitMine note was $2,554.67. A close back above $2,700 would retrace that break. A close under $2,555 would put the week’s low back in play. The October 8 price near $2,572 sits between those two, closer to the low than to the high.
The Glamsterdam upgrade activated on the Sepolia testnet on October 6 at 13:53:36 UTC, at epoch 353,024. It pairs enshrined proposer-builder separation under EIP-7732 with block-level access lists under EIP-7928. Hoodi and mainnet dates are not set. The October 7 story covered the fork. A testnet activation can coincide with a selloff. It does not explain a $506 million ETF withdrawal.
BitMine’s cap, and what it does not do
BitMine Immersion Technologies chairman Tom Lee said on October 7 at TOKEN2049 that the company will not acquire more than 5% of Ethereum’s supply. BitMine’s holdings as of October 5 were about 6.02 million ETH, or about 4.9% of supply, leaving a thin gap before the line he set. BMNR shares fell 7.14% to $24.33 in U.S. trading that day. They opened at $24.95 after a prior close of $26.20, traded between $24.30 and $25.18, and about 13.08 million shares changed hands by 15:06 UTC.
The Crypto Times reported that statement. A cap on one treasury buyer is not a market-wide bid, and it is not a sale. The firm has not said it will reduce the 6.02 million ETH. It has said it will not keep buying through 5% of supply.
What to watch
The next Farside row will show whether the five-session outflow streak breaks. A sixth withdrawal would extend the longest ether-ETF drain of the month and would follow a week in which two sessions already exceeded $160 million. A flat or positive print would not, by itself, put $2,700 back. Creations would have to persist, and the spot would have to trade through the October 7 high before that level is a close rather than a wick.
On the chart, $2,555 is the October 7 low, and $2,723 is that session’s high. CoinGlass’s long-heavy split is the derivatives tell. If a spot slips under the week’s low, the same positioning that produced $91 million in long liquidations on the later board can add to the move. If the spot holds, part of that fuel is already spent: the 12-hour column was $17 million, against $104 million for the full day. Bitcoin’s own session, covered separately, was testing $82,000 after a $487 million spot-ETF outflow on the same date. Ether’s outflow was smaller in dollars and larger relative to the prior ether-ETF week.
Also Read: Bitcoin (BTC) Price Today Tests $82K Support as ETF Outflows Hit $487M