
Bitcoin extended its slide on October 8, moving into the $82,000 area that analysts have identified as an important support zone for the month.
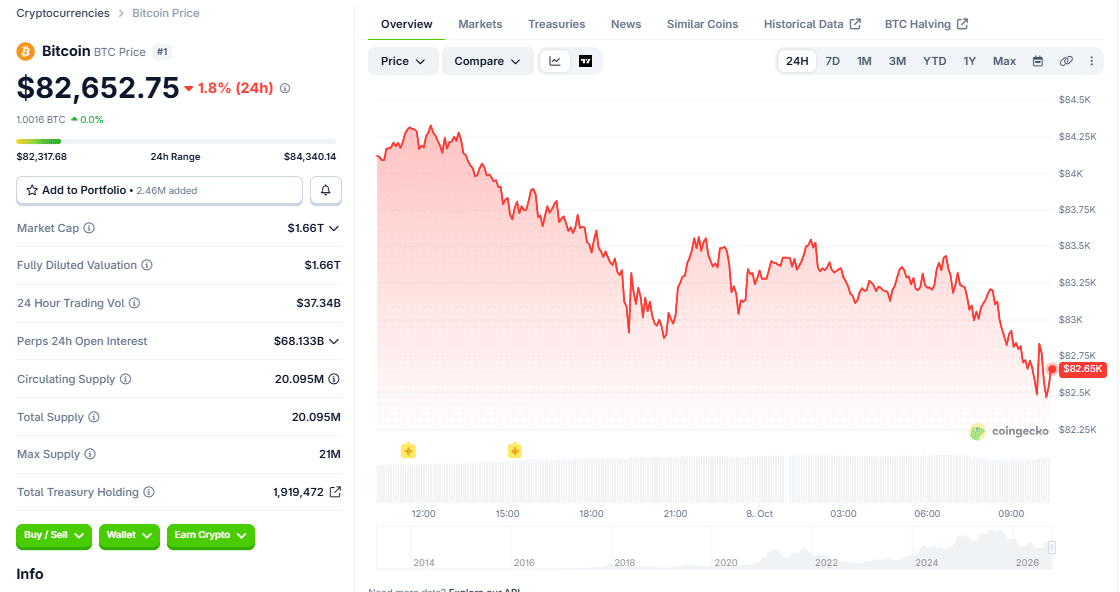
BTC was trading at about $82,652.75 as of 04:55 UTC, down 1.8% over the prior 24 hours, according to CoinGecko data. The move carried it to the lower end of a 24-hour range of $82,317.68 to $84,340.14, putting the cryptocurrency close to the support level highlighted by analysts entering October.
At the snapshot, Bitcoin had a market capitalization of about $1.66 trillion and 24-hour trading volume of roughly $37.34 billion, according to CoinGecko. Perpetual-futures open interest stood near $68.13 billion. Bitcoin’s circulating supply was about 20.095 million BTC against its 21 million maximum supply. CoinGecko also tracks 1,919,472 BTC held by public companies and governments, although those holdings are separate from Bitcoin’s circulating-supply figure.
Why Bitcoin Is Down
Bitcoin’s latest decline follows a series of leveraged liquidations and a cautious macro backdrop. Over the prior day, Bitcoin had already fallen to the $84,000 area as $546 million in positions were liquidated, around 88% of them longs, in a cascade that at one point pushed BTC toward $83,000 with 94% of liquidations hitting longs.
That followed a similar $433 million liquidation event after an $87,000 rejection earlier in the week, according to CoinGlass data.
The macro backdrop is also keeping attention on U.S. monetary policy. The Federal Reserve raised its target range by 25 basis points to 3.75%–4.00% at its September 16 meeting. The minutes released October 7 said most participants believed another increase in the target range would likely be appropriate by year-end, although future decisions would depend on incoming economic data and the balance of risks.
Spot Bitcoin ETF flows have also become an important market variable. US spot Bitcoin ETFs posted net outflows of about $487.07 million on October 7, their heaviest single-day withdrawal in weeks, according to SoSoValue data. That capped a choppy run of flows: the funds took in $118.86 million on October 6 but had bled $89.9 million on October 5, following inflows of $189.84 million on October 2 and $102.67 million on October 1, and an outflow of $148.69 million on September 30.
The October reversal stands in contrast to a stronger stretch in late September, when spot Bitcoin ETFs recorded $998.95 million in net inflows on September 21, $714.75 million on September 22 and $346.98 million on September 23. Following the October 7 outflow, cumulative net inflows since launch stood at about $57.33 billion, while total net assets across the funds were roughly $107.40 billion and daily trading volume was about $2.80 billion, according to the SoSoValue snapshot.
The shift in ETF flows adds another source of pressure as Bitcoin’s derivatives market remains heavily leveraged. When spot ETF flows turn negative while leveraged positions are being liquidated, the combination can amplify downside volatility, although the flow data alone does not establish the cause of Bitcoin’s decline.
What Analysts Are Saying
ViaBTC chief analyst Jeff Ko has identified the 82,000–83,000 area as an important support zone. Ko said that if the area continues to hold, he would view the price action as a consolidation following Bitcoin’s September breakout.
Lacie Zhang, research lead at Bitget Wallet, puts the main downside liquidation zone at 82,000–82,500. She has warned that losing the area could accelerate a decline toward $80,000. On the upside, Zhang sees $87,500 as the level Bitcoin needs to reclaim before a move toward $95,000 becomes possible. Her October range is 78,000–95,000. Zhang has also cautioned that “seasonality alone is not an investment thesis,” meaning Bitcoin’s historical October performance does not by itself establish a bullish outlook.
Tim Sun, senior researcher at HashKey Group, has taken a more cautious view of the Federal Reserve’s next move. Sun said another October rate increase could lead investors to interpret September’s hike as the beginning of a broader tightening cycle rather than a one-off move.
The Crypto Times does not forecast Bitcoin’s price; the levels cited above reflect the analysts’ respective views.
The Uptober Test
Bitcoin’s October performance is also being tested against the market’s usual “Uptober” narrative. The month began with BTC in the low $80,000s, as The Crypto Times previously reported.
The broader crypto market has also weakened alongside Bitcoin. XRP, for example, has fallen on the week, while leveraged liquidations have affected multiple major crypto assets.
Rather than treating October seasonality as a standalone signal, analysts are watching ETF flows, derivatives positioning, inflation data and Federal Reserve policy expectations alongside the price levels.
What to Watch
The immediate technical focus is whether Bitcoin can hold the $82,000 area identified by Ko and Zhang. Zhang has said a sustained break below $80,000 would weaken her bullish October setup, while a recovery through $87,500 would strengthen her case for a potential move toward $95,000.
Beyond price levels, traders will be watching spot Bitcoin ETF flows and U.S. monetary-policy expectations. The Federal Reserve’s next scheduled meeting is October 27–28.
With derivatives positioning still significant, further deleveraging could amplify Bitcoin’s next move, but the direction will depend on actual price action and incoming market data rather than the support levels alone.