
Key Highlights
- Ethereum jumped 9% in 24 hours to $2,085, reaching an intraday high of $2,089.09 after trading as low as $1,905.44.
- U.S. spot Ethereum ETFs attracted $102.3 million over August 17–18, while falling Treasury yields and a weaker dollar added a macro tailwind.
- CryptoQuant flagged an unusual divergence: ETH gained more than 20% while futures volume dropped about 70%, suggesting leverage has not been the main engine of the recovery.
Ethereum (ETH) broke decisively above $2,000 on Wednesday, extending its August recovery as a combination of improving macro conditions, renewed ETF demand and relatively subdued derivatives activity pushed buyers back into the market.
According to the CoinGecko snapshot taken at 12:00 PM ET, ETH was trading at $2,087, up 9.1% over 24 hours, after touching $2,089.09. Its 24-hour trading volume stood near $12.92 billion, while market capitalization climbed above $251 billion.
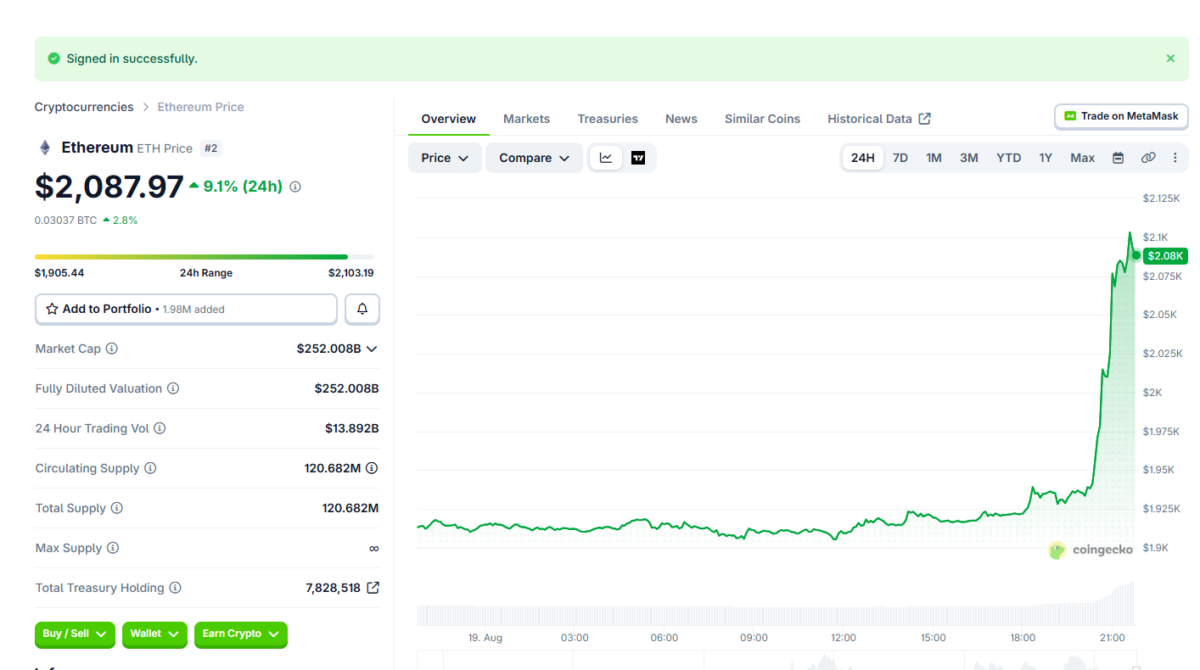
Ether also gained about 3% against Bitcoin over the same period, showing that Wednesday’s move was not solely a broad crypto-market rebound.
Why Is ETH Up 9% on August 19?
The strongest explanation for Ethereum’s sudden move is a short squeeze.
Ethereum liquidation data from coinglass taken at 12:15 PM ET shows approximately $509.22 million in leveraged ETH positions were liquidated over 24 hours.
Of that amount:
- $463.46 million came from short positions
- $45.77 million came from long positions
Shorts therefore represented 91.01% of all Ethereum liquidations during the period.
The imbalance shows that traders betting against ETH were caught as the price moved sharply higher.
When a short position is liquidated, the position is forcibly closed as price moves against the trader. In a heavily shorted market, those forced closures can add buying pressure and push the price higher, triggering additional liquidations.
Ethereum’s move above $2,000 appears to have produced exactly that feedback loop.
$500 Million in ETH Positions Liquidated in Four Hours
The timing of the liquidations provides stronger evidence that derivatives amplified the rally.
Around $500.85 million of ETH positions were liquidated within four hours, almost the entire $509.22 million recorded across the full 24-hour period.
Four-hour liquidations included:
- $457.01 million in shorts
- $43.84 million in longs
During just one hour, another $278.12 million was wiped out, including $252.27 million in bearish positions.
The peak liquidation period occurred between 20:30 and 21:30 on August 19, while the largest individual liquidation was approximately $32.18 million.
A total of 16,782 traders were liquidated as ETH volatility exceeded 11% during the session.
The concentration of liquidations within such a short window closely matches Ethereum’s vertical move from below $2,000 toward $2,090.
Binance Shorts Take $192 Million Hit
Binance recorded the largest amount of ETH liquidations among the exchanges shown in the data.
Approximately $196.27 million in ETH positions were liquidated on Binance, including:
- $192.20 million in shorts
- $4.07 million in longs
Short positions therefore represented almost 98% of ETH liquidations on the exchange.
Bybit recorded another $68.02 million, including approximately $67.62 million in short liquidations.
The exchange-level data reinforces the broader market picture: Ethereum’s rally was heavily tilted toward the forced closure of bearish positions rather than leveraged longs being taken out during volatility.
Ethereum ETFs Add $343 Million in August
U.S. spot Ethereum ETFs recorded $71.4 million in net inflows on August 18, according to data of Farside Investors gathered at 12:00 PM ET.
BlackRock’s ETHA accounted for $64.7 million, or roughly 91% of the day’s total. Bitwise’s ETHW added $1.4 million, Invesco’s QETH recorded $1.1 million, Grayscale’s ETHE added $1.5 million and its lower-fee ETH fund took in $2.7 million.
The inflow followed another $30.9 million on August 17, bringing combined net inflows over the two completed sessions to $102.3 million.
Across August, the funds have now accumulated approximately $343 million in net inflows through August 18.
The August 19 row on Farside currently shows $0.0 million, but the day’s ETF figures have not been finalized. August 18 therefore remains the latest completed session available for comparison.
Cumulative net flows across the U.S. Ethereum ETF products stood at approximately $11.56 billion, according to the latest Farside table.
ETH Rally Comes Despite 70% Drop in Futures Volume
The more unusual signal is coming from derivatives. Amar Tarah posted on CryptoQuant that divergence in which Ethereum gained more than 20% over the period analyzed while futures trading volume fell about 70%.
Falling futures turnover alongside a rising spot price means the rally has not required an equivalent expansion in derivatives trading.
It does not prove that every dollar behind the move is spot buying, but the combination of positive ETF flows and lower futures activity weakens the argument that ETH’s recovery is being driven primarily by leveraged traders.
That differs from rallies where futures volume and open interest expand rapidly alongside price, leaving the market more exposed to forced long liquidations if momentum reverses.
Ethereum showed a similar divergence earlier in August. Between August 1 and 5, ETH climbed toward $1,900 even as futures volume fell about 16%–18% across major exchanges, suggesting derivatives participation had already begun cooling while price recovered.
Can Ethereum Price Hold Above $2,000?
The next test is whether ETH can convert $2,000 from resistance into support.
Wednesday’s intraday high around $2,089 puts the $2,100 area immediately above the market. A sustained break through that zone, accompanied by continued ETF inflows and stronger spot turnover, would provide further confirmation that the breakout is attracting fresh capital rather than producing a short-lived liquidity spike.
A previous Crypto Times August outlook identified $2,200–$2,450 as the next broader upside zone if Ethereum successfully broke above $2,000.
On the downside, a move back below $2,000 would weaken the breakout, while a retest of Wednesday’s $1,905 intraday low would suggest buyers failed to establish support above the former resistance zone.
For now, Ethereum’s move above $2,000 has three identifiable sources of support: lower U.S. yields and a weaker dollar, more than $100 million of two-day ETF inflows, and a rally occurring without a comparable surge in futures speculation.
The sustainability of the breakout will depend on whether those spot and institutional flows continue after ETH’s initial 9%% move.
Also Read: Bitcoin Price Breaks $65,000 Ahead of Trump Meeting and FOMC