
Bitcoin has traded near the mid-$60,000 range in mid-August 2026, roughly half its October 2025 peak above $126,000, even as measures of global and U.S. money supply have continued to expand toward or remain near record levels.
Data compiled by various research outlets show the U.S. M2—the Federal Reserve’s broad measure of cash, checking and savings deposits, money-market funds and similar liquid assets—stands around $23.3 trillion, while composite global M2 figures from major economies have also posted year-over-year growth, in some readings exceeding 105 in recent periods.
This divergence has drawn attention because many market observers had previously highlighted a relationship in which Bitcoin’s price tended to move in a similar direction to changes in M2, often with a lag of several weeks to a few months.
The current gap—where money supply has risen while Bitcoin has declined—represents one of the more pronounced separations in the datasets examined by research firms. Analysts are examining the pattern without a consensus on its causes or duration.
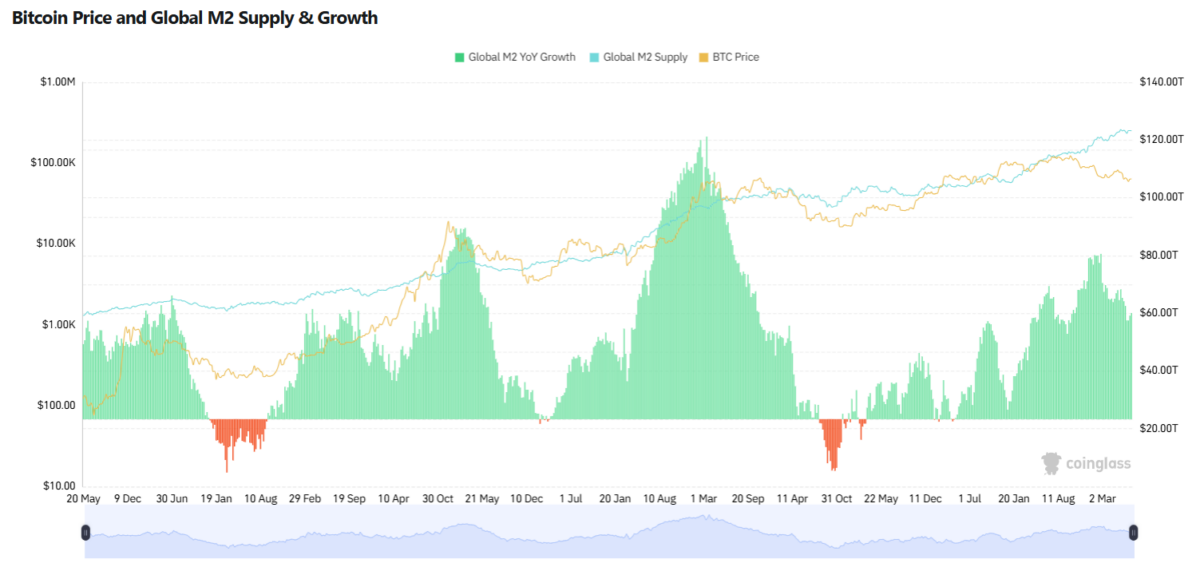
Bitcoin’s Price Divergence from Money Supply Growth
Bitcoin’s all-time high above $126,000 occurred in October 2025. By August 2026 the price had fallen into the low-to-mid $60,000s, a decline of more than 50% from that peak and roughly $55,000 lower than levels a year earlier in some comparisons. During the same stretch, global M2 aggregates continued expanding, with one indexed comparison from early 2024 showing M2 rising substantially while Bitcoin’s corresponding index contracted.
At the time of publishing (12:50 PM – August 18, 2026), Bitcoin was trading near $64,200 with a market cap of $1.29 trillion, as per data from CoinGecko.
M2 itself is a standard monetary aggregate. It includes physical currency, demand deposits, savings deposits, small time deposits and retail money-market funds—assets that can relatively quickly be spent or invested. Global versions typically sum similar figures across major economies such as the United States, euro area, Japan and China, sometimes adjusted for exchange rates.
A research from Bit.com noted that while longer-term level correlations between Bitcoin and these series have historically registered in the 0.5 to 0.9 range depending on the exact window and methodology, shorter-term rolling correlations have turned negative over the past year in several calculations. One research note cited a 1-year rolling correlation with U.S. M2 near –0.87 as of mid-August 2026.
Regression models tracking Bitcoin’s sensitivity to M2 have shown declining explanatory power (R-squared values falling in some estimates from the 0.7–0.9 range in earlier tightening periods toward approximately 0.59), with implied model values at times substantially higher than market prices. These observations come from quantitative providers and institutional research desks examining the same public data series.
The Historical Correlation Narrative
For more than a decade, a segment of market analysis has pointed to co-movement between Bitcoin and broad money-supply measures. Full-sample correlations have been reported as high as 0.86 on a linear basis and higher on a logarithmic basis in some studies covering multi-year periods.
The economic intuition often offered is that expansions in money supply can ease financial conditions and eventually support demand for scarce assets; Bitcoin’s fixed issuance schedule of approximately 21 million coins has been cited as a reason it might respond with higher volatility to such flows.
Many presentations of the relationship incorporate a time lag—commonly estimated in the range of one to three months, or around 10 to 12 weeks in popular overlays—on the grounds that liquidity takes time to transmit through the financial system into risk assets. Independent macro researchers such as Lyn Alden have published long-run level correlations reaching 0.94 in certain windows spanning 2013–2024. Institutional teams, including Fidelity Digital Assets, have previously quantified that a large share of Bitcoin’s historical price variation could be statistically associated with changes in global M2.
These figures measure association rather than strict causation. Contemporaneous monthly-change correlations have been described as much weaker than level correlations, and the relationship has varied across market regimes—stronger during certain expansion phases and less consistent during drawdowns.
Competing Explanations from Market Analysts
Analysts have advanced several accounts for why the pattern has diverged in 2025–2026. Raoul Pal of Real Vision and Global Macro Investor has previously linked temporary breaks to U.S. Treasury operations, specifically large-scale bond issuance used to rebuild the Treasury General Account, which can drain reserves from the banking system even while headline M2 expands. In more recent commentary he has described Bitcoin as a young, volatile asset that can “run cold” relative to liquidity for stretches without invalidating the longer-term linkage.
In its research, Fidelity Digital Assets has noted the recent crumbling of rolling correlations and posed the question of whether the divergence challenges the broader liquidity thesis or instead reflects that M2 has become a less complete proxy for the liquidity that actually reaches risk assets. The firm’s work continues to reference the longer historical association while highlighting transmission issues.
Other observers point to Bitcoin-specific factors. These include sizable ETF flows (both inflows and later outflows), a notable deleveraging event in October 2025, and profit-taking by longer-term holders. Quantitative notes from CF Benchmarks have described the current gap between model-implied values and market prices as among the widest in their dataset, leaving open whether it constitutes a lag that historically resolved higher or a more lasting shift.
A minority view, advanced by Capriole Investments founder Charles Edwards, attributes part of the decoupling to market pricing of quantum-computing risks to Bitcoin’s cryptography, arguing that 2025 marked entry into a “Quantum Event Horizon” in which the perceived timeline to potential vulnerability shortened relative to upgrade timelines.
Differing Interpretations of the Path Ahead
As mentioned, views on implications diverge. Some analysts, including those associated with Fidelity and certain corporate Bitcoin holders, treat the episode as consistent with past temporary overrides by supply-side or idiosyncratic events and expect the historical relationship to reassert once transmission improves or risk appetite returns. Others, in contrarian voice, note that prior large-scale decoupling episodes have at times coincided with major cycle tops followed by multi-year periods of underperformance.
Research groups emphasize that M2 remains only one of several liquidity and macro indicators beside dollar strength, real yields, equity-market correlations, on-chain holder behavior and institutional flow.
Corporate holders such as Strategy and Metaplanet have often framed Bitcoin’s fixed supply schedule as unchanged regardless of near-term price action relative to expanding money aggregates.
The data highlighted above show a clear recent separation between Bitcoin’s price path and continued growth in broad money-supply measures. Analysts continue to debate whether the break is primarily a lag or plumbing issue, a reflection of competing capital uses, a Bitcoin-specific flow dynamic, or a signal of changing market regimes. No single explanation has achieved consensus, and the relationship’s longer-term statistical associations remain a subject of ongoing examination rather than settled prediction.
Also read: Georgia Man Faces Charges in $165M Crypto Ponzi Scheme