
Ethereum (ETH), the second-largest cryptocurrency by market capitalization, continues to trade in a tight range around $1,900 to $1,913 as of early August 6, 2026. The asset has shown signs of stabilization after a turbulent year, with price action reflecting a gradual recovery from mid-year lows while remaining well below its all-time highs.
Trading volumes for ETH have moderated recently compared to peaks seen in late July, contributing to the sideways movement. Broader crypto market conditions, including elevated Bitcoin dominance and cautious sentiment reflected in the Fear & Greed Index lingering in extreme fear territory, have tempered enthusiasm.
Still, Ethereum’s foundational role in decentralized applications, DeFi, and staking continues to underpin longer-term interest from both retail and institutional players.
Recent Price Trajectory Shows Stabilization After June Lows
Ethereum’s price path over the past several months illustrates a classic recovery phase following deeper declines. In June 2026, ETH bottomed in the $1,500 to $1,600 region, marking a significant drawdown from its August 2025 all-time high near $4,955.
From those lows, the cryptocurrency staged a notable rebound through July, climbing toward local highs around $1,950 to $1,980 by late in the month, with one peak near $1,977—as per CoinMarketCap data.
Into early August, the price has consolidated primarily between $1,850 and $1,950. Daily closes in the first week of the month hovered near $1,905 to $1,910, with modest gains of around 2% on some sessions after earlier dips.
Over the past week, movement remained contained within an approximate $1,820 to $1,930 band. Year-over-year, ETH is down roughly 47% to 51% from levels near $3,600 to $3,700 twelve months prior. The 52-week range spans from about $1,508 on the low end to the prior peak near $4,956.
This trajectory positions Ethereum above its long-term average in certain datasets yet still recovering from the substantial correction that followed the 2025 highs. Short-term resilience has been evident as buyers stepped in during pullbacks, preventing a return to the deeper June levels.
Technical Indicators Signal Constructive Bullish Structures
Multiple chart patterns and technical readings currently favor a constructive outlook for Ethereum, particularly on intermediate timeframes. A double-bottom formation, with lows near $1,520 in June and July, saw a breakout above the neckline around $1,805. As long as that level holds as support, measured-move projections point toward the $2,100 to $2,180 zone, which aligns closely with the approximate 200-day simple moving average.
Following the break above $1,800, a bullish flag pattern has emerged in the subsequent consolidation between roughly $1,830 and $1,930. A decisive push beyond the upper boundary near $1,930, ideally accompanied by expanding volume, could open the path toward $2,500 in the near term according to recent technical assessments. This would also represent a reclaim of longer-term trend indicators such as the 200-day exponential moving average.
The Year-to-date (YTD) chart currently shows ETH price sits above key shorter-term moving averages, including the 10-, 20-, and 50-day EMAs, providing a supportive short-term bias. It remains below the 100- and 200-day averages, however, indicating that the broader recovery is incomplete.
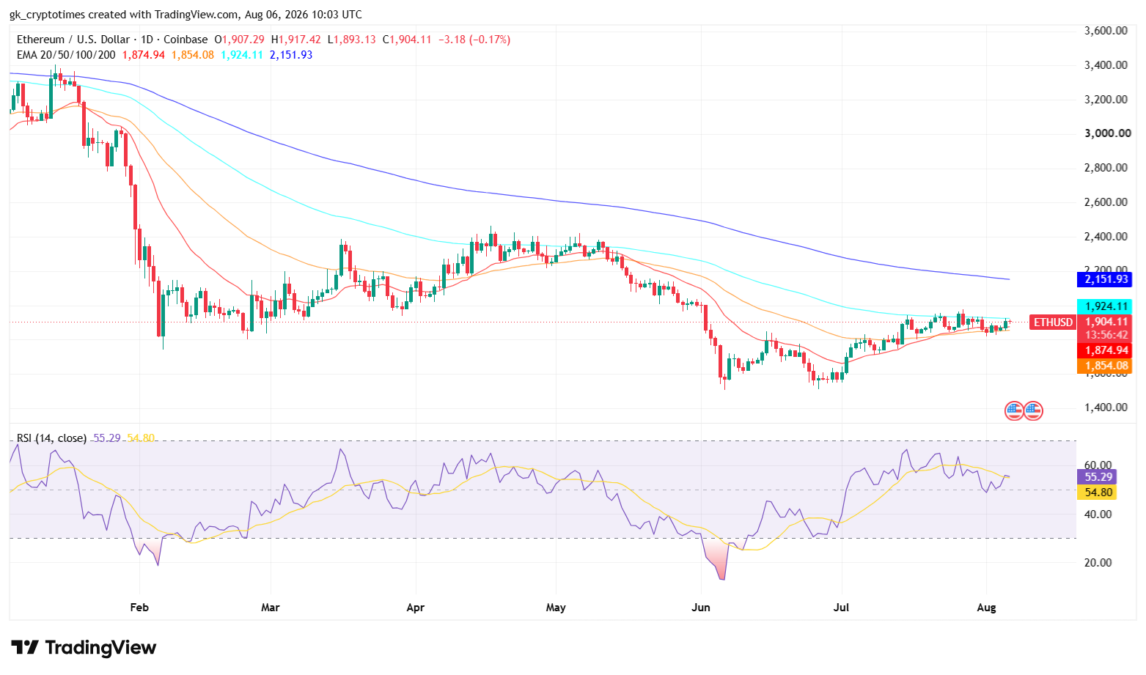
The Relative Strength Index (RSI) has hovered in the neutral to mildly bullish territory of 50 to 57, avoiding overbought conditions while showing room for further upside momentum. MACD readings present a mixed but improving picture, with golden crosses observed on lower timeframes such as the 1-hour and 4-hour charts, though daily signals have occasionally shown fading strength.
Historical seasonality adds another layer of support. Data indicates that Ethereum has historically posted average gains of about 18% in August following a positive July close, with positive returns in three of four comparable years. Combined, these elements form a coherent bullish framework that many technicians view as a potential continuation of the post-June recovery, contingent on volume confirmation and defense of support near $1,800 to $1,850.
On-Chain Metrics and Broader Outlook Reinforce Accumulation Theme
Beyond pure price action, on-chain data provides additional evidence of underlying strength. Whale wallets have continued accumulating ETH in recent weeks, with notable OTC and exchange-related purchases exceeding tens of thousands of tokens.
CryptoQuant data shows that ETH exchange balances have trended lower over time, currently sitting at 15.08 million—reducing the immediate supply available for sale and contributing to a potential squeeze dynamic. Staking ratios have reached record or near-record levels around 34% of circulating supply, further locking up tokens and supporting scarcity narratives. Spot Ethereum ETF flows have shown periods of positive net inflows by amassing over $626 million this week so far.
Moreover, network activity metrics, including smart contract deployments and pockets of rising DEX fee generation, suggest that fundamental usage remains resilient even as price has cooled from July highs.
The extreme fear reading on sentiment indices is often interpreted as a contrarian signal that can precede rebounds when paired with accumulation trends. Earlier in July, an MVRV golden cross—where the market-value-to-realized-value ratio crossed above its 160-day moving average—was flagged by some observers as an additional reversal indicator.
Various analysts on X states that a confirmed breakout on rising volume could accelerate gains toward the higher targets discussed by analysts, while a failure to hold recent support might invite deeper retracements. Macro factors, regulatory developments, and Bitcoin’s relative performance will likely influence the path as well.
“The last 3 times it tested the 1D EMA 50/200 trend, each time it was a local top. If ETH can finally break and hold above $2K, we could see a serious upside continuation,” says CryptoPoseidonn, a popular crypto trader.
Looking ahead, the combination of these technical structures, short-term moving average support, and on-chain accumulation paints a cautiously optimistic picture for Ethereum in the near term. Key levels to monitor include resistance near $1,930 to $2,000 and support in the $1,800 to $1,850 region.