Key Highlights
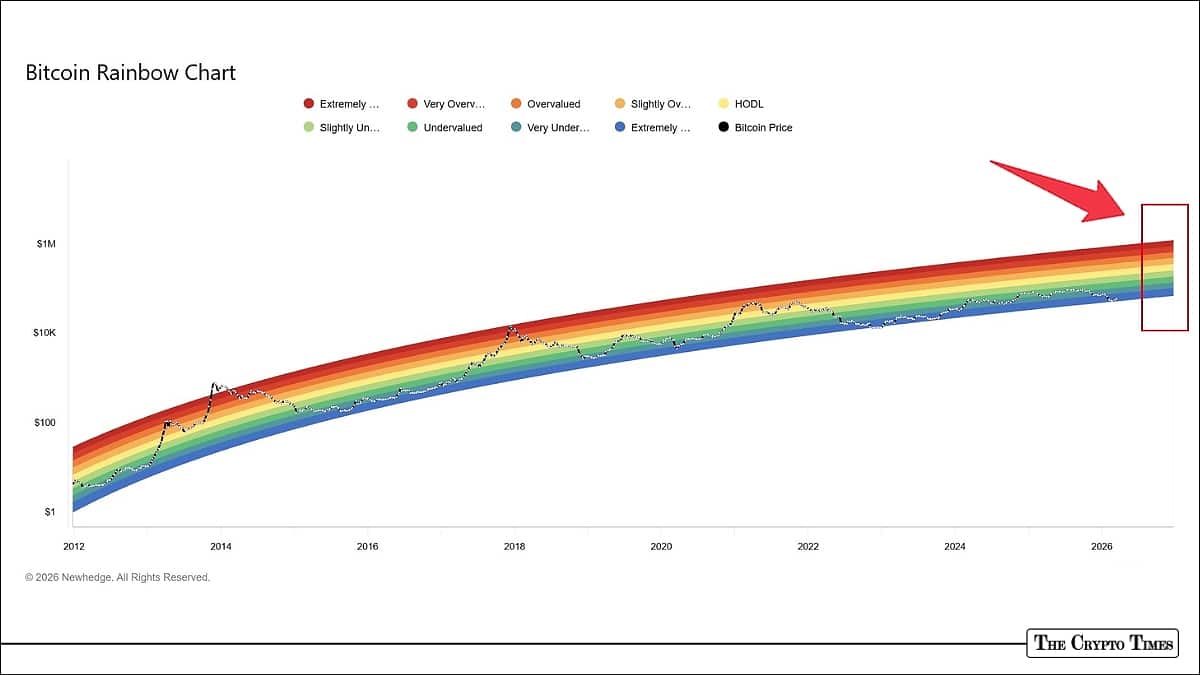
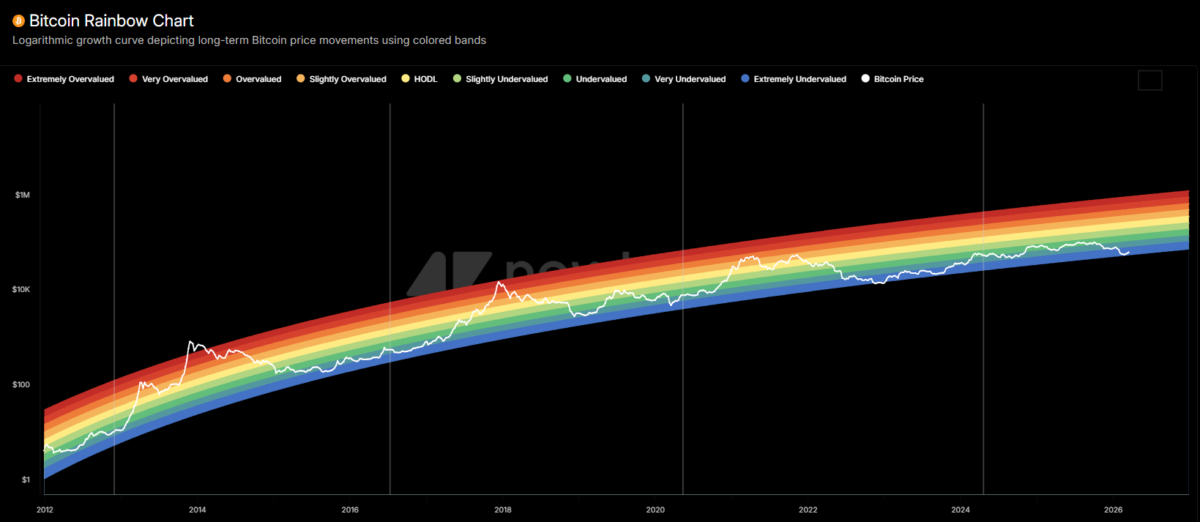
- Bitcoin Rainbow Chart places BTC price in the “Extremely Undervalued” or “Basically a Fire Sale” zone; the bottom blue/purple band historically marking prime long-term buying opportunities after corrections.
- The logarithmic tool has reliably flagged accumulation phases before major rallies (e.g., pre-2017 and 2021 bull runs), with maturing cycles showing less extreme peaks; today’s depressed positioning suggests room to climb into mid-to-upper bands like “HODL!” (yellow/green) or “FOMO” (orange).
- Forecasts from Bernstein ($150K by end-2026, $200K by 2027), Galaxy Digital’s Alex Thorn ($250K by 2027), and community extrapolations tied to the chart’s bands converge on $150K–$440K highs in late 2026–2027.
Bitcoin finds itself in a familiar spot for long-term holders: deep in the bargain bin, according to the Bitcoin Rainbow Chart that’s been coloring crypto conversations since 2014.
On March 18, 2026, with BTC hovering around $74,270, the popular logarithmic valuation tool places the asset squarely in the “Extremely Undervalued” zone—the coolest, bluest band at the bottom, often labeled a “Basically a Fire Sale” or equivalent in community versions. It’s the kind of territory that has historically preceded major rallies, even if the model itself comes with plenty of disclaimers.
Right now, the chart shows BTC well below its long-term trend, in a depressed phase following what many see as a partial cycle peak.
Market data from CoinMarketCap shows that Bitcoin hit the all-time high of $126,198 on October 7, 2025 before correcting nearly 50% into early 2026—a pullback that landed it in accumulation territory across multiple Rainbow variants.
At this time, cooler bands like “Accumulate,” “Still Cheap,” or “BUY!” dominate recent analyses, with some forward projections for late March putting fair value closer to the mid-green zones.
The Rainbow Chart, first sketched out by a Reddit user known as Trolololo back in 2014, plots Bitcoin’s price on a log scale against a power-law regression curve meant to capture its exponential-but-diminishing growth.
Eight color bands fan out from that trend line: deep purples and blues signal undervaluation and buying opportunities, while yellows, oranges, and reds scream caution or outright euphoria. Halving dates are marked like mileposts, reminding viewers that Bitcoin’s supply shocks every four years have reliably kicked off bull phases.
Echoes of past cycles
History gives the Rainbow its staying power. In earlier cycles, Bitcoin bottomed in those lower blue zones before exploding upward: post-2016 halving lows in deep undervaluation gave way to the 2017 mania that touched red “Maximum Bubble Territory.”
The 2021 top near $69,000 landed in orange “FOMO” or bubble bands before the brutal bear market reset. Peaks have trended less extreme over time—maturing market, bigger cap, institutional money—meaning today’s cycle might not need to hit the wildest reds to call it done.
The original model even projected $1 million by September 2026, though updated versions (post-2022/2023 recalibrations) temper that optimism, reflecting lower volatility and a shifted curve. Still, the chart’s bands for late 2026 often imply substantial upside from current levels if the pattern holds.
What it means for the road ahead
Traders and HODLers are watching these undervalued readings closely. It currently suggests room for a multi-fold move higher, potentially into yellow “HODL!” or orange “Is this a bubble?” territory later in 2026 or 2027.
Bernstein analysts remain steadfastly bullish despite the recent correction, calling the current downturn the “weakest bear case in Bitcoin’s history.” They hold a $150,000 target for the end of 2026, with a step-up to $200,000 by 2027, driven by persistent ETF inflows and institutional adoption that could propel price steadily higher—mirroring the Rainbow Chart’s historical pattern of climbing from undervalued blue zones into mid-to-upper bands without extreme euphoria.
Galaxy Digital’s Alex Thorn offers a longer-horizon view, forecasting Bitcoin at $250,000 by the close of 2027 while acknowledging 2026’s chaos—with roughly equal odds of trading near $70,000 or $130,000 mid-year. This tempered optimism fits the Rainbow’s maturation narrative: less volatile peaks than past cycles, but still substantial room from today’s depressed positioning toward fair-value green/yellow territory and beyond if adoption trends accelerate.
Community extrapolations and AI-assisted reads point to cycle highs anywhere from $150,000 to $440,000, depending on how aggressively price climbs the bands. Conservative views peg realistic tops closer to $200,000–$300,000 in the mid-to-upper ranges, while outliers dream bigger.
Of course, the creators are blunt: it’s no crystal ball. “Just a model, not a crystal ball,” Trolololo warned years ago, and “it will be correct until one day it isn’t.” Historically, bubbles have broken bands before, and black-swan events can warp any regression. Yet the Rainbow’s track record on spotting relative cheapness has kept it relevant.
For now, with Bitcoin in the bargain basement amid a post-correction lull, the chart flashes a classic long-term buy signal. Whether this cycle delivers another parabolic run or a more measured climb remains a big unknown, but the colors are leaning toward green shoots ahead.
Also read: Metaplanet Raises $255M to Fuel Bitcoin Treasury Toward 210,000 BTC