
Key Highlights
- Bitcoin is consolidating around $66K, with traders marking $67.5K–$69.6K as near-term resistance and $66.2K–$64.7K as support.
- Chart watchers flag an open CME gap near $65,575–$65,826 and a deeper downside magnet below $65K if stops get swept.
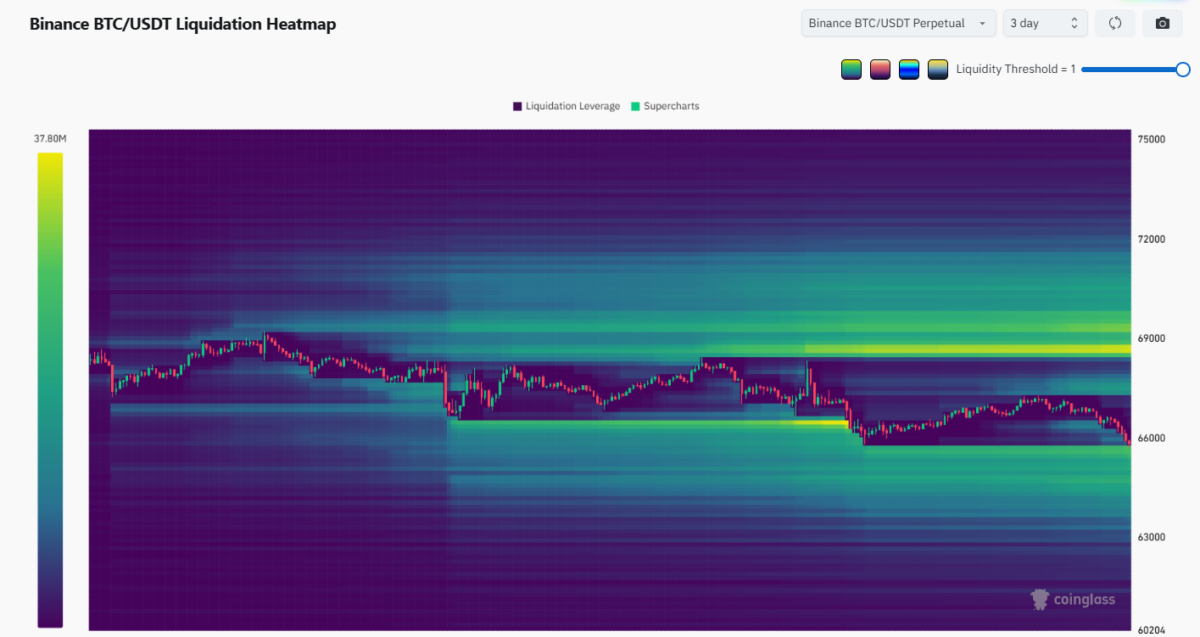
- Social dashboards highlight liquidation liquidity building around $69K–$72K, while on-chain commentary warns thin liquidity is capping sustained rebounds.
Bitcoin (BTC) is trading in a tight range around $66,000 after repeated attempts to reclaim $70,000 faded. Traders are focused on two nearby “magnets”: overhead liquidation liquidity between roughly $69,000 and $72,000, and a still-discussed CME gap region around the mid-$65,000s.
The market’s current shape is classic compression. Short-term bounces have struggled to turn into follow-through, while dips are being bought quickly enough to keep price pinned in a narrow band. That combination tends to build tension: when one side finally gives, moves can accelerate as stops and liquidations stack into a single direction.
Liquidity builds between $69K and $72K
On the upside, social dashboards and trader posts point to a “liquidation cluster” sitting above a price of around $69,000–$72,000. When liquidation liquidity stacks overhead, it can pull the price upward if momentum starts, because short positions get forced to buy back (a squeeze), adding fuel to the move.
That’s why many traders are watching the $70,000 area closely. If BTC can push into that zone and hold, the path toward the liquidity pocket can open quickly. If it fails near $70K again, the move can reverse just as fast, trapping late longs and snapping price back into the range.
CME gap and the $65K zone remain key downside risk
On the downside, a frequently referenced chart flagged an open CME gap area around $65,575–$65,826 (noted as a Binance-equivalent range), keeping attention on the mid-$65Ks. While gaps do not “have” to fill, many traders treat them as psychological targets, especially in a market already trading close enough to test them.
Analysts also argued that stops under ~$65,000 remain a likely draw for price, suggesting that a sweep below $65K could occur before any sustained rebound. In that scenario, traders would watch whether BTC quickly reclaims the range (a potential shakeout) or breaks down further (a trend continuation).
Key levels traders are watching
A set of commonly shared near-term levels puts resistance “above” at $67,508, $68,690, and $69,635, while support “below” is marked at $66,250, $65,750, and $64,690. In practical terms, bulls want to see BTC reclaim the upper band of the range and hold above the high-$67Ks, while bears will look for a clean push toward the mid-$65Ks and potentially below $65K to trigger a larger washout.

Path to $70K-$80K
On-chain analytics firm Glassnode framed the recent action as “demand exhaustion” near $70,000, arguing that thin liquidity conditions can make a sustained recovery into the $70,000–$80,000 area structurally challenging. The takeaway for traders is that even if BTC rallies into the low-$70Ks, follow-through may depend on whether spot demand returns strongly enough to absorb profit-taking and prevent another rejection.
For now, February’s story remains a battle between a tight range near $66K and nearby liquidity pools above and below. If either side breaks with force, volatility is likely to expand quickly as stops and liquidations cascade, turning what has been a slow grind into a fast move.
Also Read: Bitcoin Sinks 45% From ATH: Why Even Long-Term Holders Are Selling