Key Highlights
- Bitcoin held the $76,000 zone while Ethereum slipped under $2,270 as the broader market cap dipped to $2.63 trillion, with weak risk appetite extending into a third session.
- US spot Bitcoin ETFs bled $137.77M on April 29 — the third straight day of outflows — led by BlackRock IBIT (-$54.73M) and Fidelity FBTC (-$36.13M); Ethereum ETFs lost $87.73M with FETH (-$48.37M) and ETHA (-$37.06M) the worst hit.
- XRP spot ETFs were the only bright spot with +$3.59M in net inflows led by Bitwise XRP and Franklin XRPZ, while SOL ETFs printed flat at $0.00 — leaving traders watching $74,000 BTC support and the Fear & Greed reading at 33.
The global crypto market traded lower on Thursday, with total market capitalization at $2.63 trillion, down roughly 0.4% over the past 24 hours and total trading volume around $107.3 billion. Bitcoin dominance held firm at 58.0%, with Ethereum dominance at 10.5%, showing capital remained anchored in majors rather than rotating into altcoins.
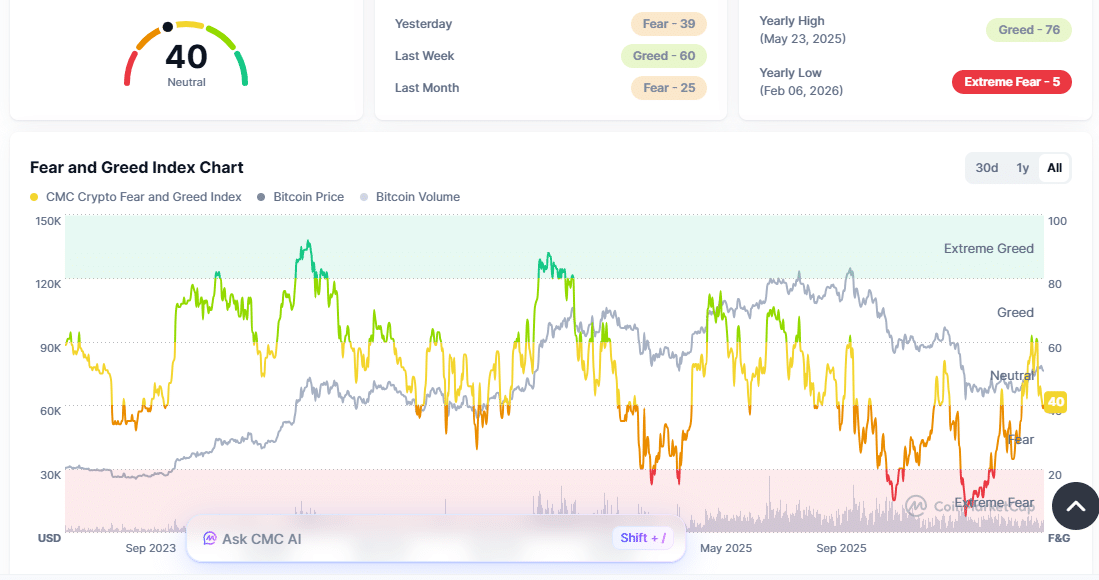
Sentiment is decisively risk-off. The Crypto Fear & Greed Index sits at 33, in the Fear zone, 14 points below the prior week’s reading — a notable cooldown after April briefly tagged Greed territory. The backdrop is being shaped by stalled US–Iran peace talks, an extended closure of the Strait of Hormuz, and pre- and post-FOMC repositioning following the Federal Reserve’s decision to hold rates at 3.75% with four dissenting votes.
Price data: Top 5 crypto assets
| Rank | Token | Price | 24H Change | Market Cap | 24H Volume | Key Level |
|---|---|---|---|---|---|---|
| 1 | Bitcoin | $76,218 | -0.12% | $1.52T | $41.4B | $74,000 support / $78,000 res |
| 2 | Ethereum | $2,268 | -0.60% | $273.7B | $22.1B | $2,250 support / $2,400 res |
| 3 | XRP | $1.37 | -0.27% | $84.5B | $2.41B | $1.30 support / $1.45 res |
| 4 | BNB | $624.10 | -1.80% | $82.89B | $1.15B | $610 support / $640 res |
| 5 | Solana | $83.68 | -0.37% | $47.9B | $4.57B | $80 support / $90 res |
Bitcoin held above $76,000 with a market cap near $1.52 trillion, while Ethereum stayed pinned around $2,267 with a market cap of roughly $273.75 billion. The standout among large caps was Dogecoin, which jumped 6.88% on the day with $4.82 billion in trading volume, bucking the broader red tape.
Top gainers and losers
Top gainers (24H)
| Token | Price | 24H Gain | Reason |
|---|---|---|---|
| Dogecoin | $0.1081 | +8.23% | Volume spike, retail rotation |
| Terra Classic | $0.00006938 | +6.20% | Speculative flows |
| Siren (SIREN) | $0.703 | +4.75% | Low-cap volatility |
Live tracking top gainers of the crypto market today shows, Dogecoin (+8.23%), Terra Classic (+6.20%) and Siren (+4.75%), and top losers WLFI (-13.17%) and Chiliz (-9.29%).
Top losers (24H)
| Token | Price | 24H Loss | Reason |
|---|---|---|---|
| World Liberty Financial | $0.0639 | -13.17% | Profit booking, weak follow-through |
| Chiliz (CHZ) | $0.0421 | -9.29% | Sector weakness, low volume |
Leverage data
Open interest pulled back into the FOMC, with futures aggregate OI sitting in the $180–200 billion institutional concentration band that has defined 2026 derivatives positioning. April started with futures open interest reaching a high of $63 billion on Bitcoin alone, but the past 48 hours have seen visible deleveraging.
| Asset | Funding Rate | Long/Short Bias | Signal |
|---|---|---|---|
| BTC | Modestly positive | Crowded long | Long buildup unwound by liquidations |
| ETH | Modestly positive | Crowded long | Cautious longs, beta-heavy |
| SOL | Slight positive | Mixed | Deleveraging from prior week |
| XRP | Positive | Speculative long | Speculative buildup |
| ADA | Negative (~-0.27%) | Crowded short | Short squeeze risk on a catalyst |
ADA continues to stand out as the cleanest counter-positioning. As of the April 20 funding window, Cardano carried the only negative funding rate with a NORMAL_SHORT classification at -0.27% across ten benchmark perpetuals, while seven tickers showed positive funding (longs paying shorts). The same dataset showed Ethereum perp OI up 13% over 24 hours while Dogecoin and Sui both drained more than 10% — a divergence still visible in this week’s flush.
Reading the tape: Price down + OI down equals long liquidations and deleveraging — the classic flush pattern playing out today. The setup leaves the market lighter on leverage than 48 hours ago, which historically allows for cleaner price discovery.
Liquidation data
| Metric | Data |
|---|---|
| Total 24H liquidations | $345 million |
| Long liquidations | ~$276 million (~80%) |
| Short liquidations | ~$69 million (~20%) |
| Most liquidated asset | BTC, followed by ETH |
Crypto derivatives logged $345 million in forced liquidations on April 28–29, with long positions absorbing 80% of the damage. The skew confirms what price action is showing: bullish leverage entered too aggressively into the $78,000 BTC test and got punished as the rejection played out. Long traders took the heavier wipeout, suggesting the downside move was accelerated by leveraged bullish positioning rather than fresh short conviction.
ETF data: Bitcoin, Ethereum, XRP, Solana
Headline ETF flows (April 29, 2026)
| Asset | Daily Net Flow | Cumulative Net Inflow | Total Net Assets | % of Market Cap |
|---|---|---|---|---|
| Bitcoin | -$137.77M | $58.07B | $99.27B | 6.55% |
| Ethereum | -$87.73M | $11.94B | $13.10B | 4.84% |
| XRP | +$3.59M | $1.30B | $1.04B | 1.23% |
| Solana | $0.00 | $1.02B | $840.78M | 1.77% |
Bitcoin ETFs: Third day of outflows, breadth weakening
US spot Bitcoin ETFs recorded $137.77 million in net outflows on April 29 — a deeper bleed than the prior two sessions and the third straight outflow day. Total net assets sit at $99.27 billion, representing 6.55% of Bitcoin’s market cap, with cumulative net inflows still healthy at $58.07 billion.
| Issuer | Ticker | 1D Net Flow | Net Assets | BTC Share | Daily Chg |
|---|---|---|---|---|---|
| BlackRock | IBIT | -$54.73M | $61.11B | 4.03% | -1.20% |
| Fidelity | FBTC | -$36.13M | $13.99B | 0.92% | -1.16% |
| Ark & 21Shares | ARKB | -$30.04M | $2.80B | 0.18% | -1.13% |
| Grayscale | GBTC | -$21.15M | $11.39B | 0.75% | -1.11% |
| Grayscale Mini | BTC | $0.00 | $4.00B | 0.26% | -1.15% |
| Bitwise | BITB | $0.00 | $2.87B | 0.19% | -1.13% |
| VanEck | HODL | $0.00 | $1.26B | 0.08% | -1.16% |
| Invesco | BTCO | $0.00 | $510.60M | 0.03% | -1.14% |
Notably, the breadth has narrowed sharply. Where April 28 saw Bitwise’s BITB act as a counterweight with +$41.2M in inflows, April 29 saw zero positive issuer prints — every active flow was negative. IBIT alone retains $61.11B in net assets and 4.03% of all BTC supply, but its three-day redemption stretch is the clearest signal of institutional pause heading out of FOMC week.
Ethereum ETFs: Worse than BTC on a relative basis
Ethereum spot ETFs posted $87.73 million in net outflows on April 29. Relative to a much smaller asset base ($13.10B in total net assets versus BTC’s $99.27B), this is proportionally heavier than the Bitcoin print — ETH funds shed roughly 0.67% of net assets in a single day versus BTC’s 0.14%.
| Issuer | Ticker | 1D Net Flow | Net Assets | ETH Share | Daily Chg |
|---|---|---|---|---|---|
| Fidelity | FETH | -$48.37M | $1.21B | 0.45% | -2.92% |
| BlackRock | ETHA | -$37.06M | $7.02B | 2.59% | -2.99% |
| BlackRock Mini | ETHB | -$2.30M | $592.20M | 0.22% | -2.97% |
| Grayscale | ETH | $0.00 | $2.02B | 0.75% | -3.02% |
| Grayscale | ETHE | $0.00 | $1.82B | 0.67% | -3.05% |
| Bitwise | ETHW | $0.00 | $235.96M | 0.09% | -3.04% |
| VanEck | ETHV | $0.00 | $113.36M | 0.04% | -3.15% |
| Franklin | EZET | $0.00 | $44.82M | 0.02% | -3.04% |
FETH led the redemptions, edging out BlackRock’s ETHA — a notable rotation given ETHA had been the dominant ETH inflow vehicle for most of April. Daily price change across the issuer set hovered around -3%, sharper than BTC ETF NAV declines of ~1.15%, confirming Ethereum’s higher beta on the day.
XRP ETFs: The bright spot
XRP spot ETFs were the only major crypto ETF category to record positive net flows on April 29, taking in $3.59 million across the issuer set. Cumulative inflows now sit at $1.30 billion against $1.04B in net assets (1.23% of XRP market cap).
| Issuer | Ticker | 1D Net Flow | Net Assets | XRP Share | Daily Chg |
|---|---|---|---|---|---|
| Bitwise | XRP | +$2.12M | $312.30M | 0.37% | -2.13% |
| Franklin | XRPZ | +$1.47M | $244.20M | 0.29% | -2.33% |
| Canary | XRPC | $0.00 | $269.38M | 0.32% | -2.18% |
| 21Shares | TOXR | $0.00 | $146.30M | 0.17% | -2.19% |
| Grayscale | GXRP | $0.00 | $64.01M | 0.08% | -2.27% |
The pattern echoes earlier April sessions where XRP funds quietly absorbed flows even as BTC and ETH cooled. With XRP price down 2.1–2.3% on the day, the inflows reflect dip-buying rather than momentum chasing — a meaningful distinction for institutional positioning.
Solana ETFs: Flat tape
Solana spot ETFs recorded $0.00 in net flows on April 29 across all eight tracked products. Cumulative inflows of $1.02B and total net assets of $840.78M (1.77% of SOL market cap) leave the SOL ETF complex still small but growing — Bitwise’s BSOL alone holds $599.68M, dominating the category.
| Issuer | Ticker | 1D Net Flow | Net Assets | SOL Share | Daily Chg |
|---|---|---|---|---|---|
| Bitwise | BSOL | $0.00 | $599.68M | 1.26% | -2.21% |
| Fidelity | FSOL | $0.00 | $104.14M | 0.22% | -2.22% |
| Grayscale | GSOL | $0.00 | $102.83M | 0.22% | -2.08% |
| VanEck | VSOL | $0.00 | $14.96M | 0.03% | -2.07% |
| Franklin | SOEZ | $0.00 | $9.25M | 0.02% | -2.20% |
| Invesco | QSOL | $0.00 | $5.91M | 0.01% | -2.01% |
| 21Shares | TSOL | $0.00 | $2.87M | 0.01% | -2.12% |
| Canary | SOLC | $0.00 | $1.14M | 0.00% | -2.06% |
Reading the flows
The cleanest read across all four ETF complexes: institutional buyers paused, but they did not panic-exit. The day’s outflows are concentrated, not dispersed — three issuers (IBIT, FBTC, ARKB) drove 88% of the BTC redemption tape, and two issuers (FETH, ETHA) drove 97% of the ETH bleed. Meanwhile, XRP saw selective dip-buying and SOL saw none of either. ETF flows are diverging from price more than supporting it, and the breadth weakening from April 28 to April 29 is the cleanest warning signal in the data.
Stablecoin and liquidity data
Stablecoin supply continues to expand alongside ETF participation, but exchange stablecoin reserves have been drifting lower over the past week — historically a sign capital is rotating off-exchange into yield, custody, or DeFi rather than queueing for spot buys. With BTC dominance still at 58% and altcoin volumes thin outside DOGE and a few low-cap movers, fresh stablecoin inflows are not yet translating into broad buying pressure.
Spot vs derivatives volume
Spot volume at roughly $41.4 billion on Bitcoin and $22 billion on Ethereum remains healthy in absolute terms but cooled relative to last week’s rally attempts. With $345 million in liquidations stacked against a relatively contained spot tape, this week’s downside was derivatives-led — leveraged longs flushed first, with spot sellers following rather than leading. That distinction matters: leverage-driven selloffs typically reset faster than spot-driven ones, provided no fresh macro shock lands.
On-chain signals
Bitcoin exchange reserves continue their multi-month downtrend — a 7-year low was tagged earlier in April — pointing to coins moving into custody and ETF wrappers rather than back to exchanges for sale. On Ethereum, the institutional accumulation story remains intact even as price lags. BitMine Immersion Technologies crossed the 5 million ETH ownership threshold with its largest weekly purchase of 2026, adding 101,901 ETH for total holdings of 5,078,386 ETH valued near $11.75 billion. The taker buy/sell ratio has also hit its highest level since January 2023, and 180-day moving average of new smart contract deployments has reached a record — a textbook fundamentals-vs-price divergence that bulls are watching closely.
A whale also moved 1,139 BTC to Kraken in the past 24 hours, a large repositioning that adds short-term sell-side risk to the tape.
Macro and traditional market setup
Macro is the dominant variable this week:
- Fed: Powell confirmed his chair term ends in May 2026, while remaining on the board afterward; the Fed held rates at 3.75% with four dissenting votes.
- Oil: Brent Crude returned above $104 a barrel as Trump weighs additional military action in Iran to renew peace talks and reopen the Strait of Hormuz. Polymarket traders are pricing further upside toward $120.
- Risk assets: Crypto opened lower on April 30 after reports of potential additional US military action in Iran, with bitcoin and ethereum’s opening prices moving progressively lower each morning this week as traders pulled back from risk assets.
- Inflation hedge: Higher oil makes inflation stickier, complicating the Fed’s path to cuts and pressuring high-beta assets including crypto.
Key levels to watch
| Asset | Support | Resistance | Breakout Level | Breakdown Level |
|---|---|---|---|---|
| BTC | $74,000 | $78,000 | $80,700 | $73,500 |
| ETH | $2,250 | $2,400 | $2,500 | $2,200 |
| SOL | $80 | $90 | $95 | $76 |
| XRP | $1.30 | $1.45 | $1.50 | $1.27 |
Bitcoin needs to hold the $74,000–$74,500 zone — it is currently maintaining a 2.96% buffer above $74,035 support — to keep the short-term structure intact. The decisive bull trigger remains $80,700, the short-term holder realized price, which represents the average cost basis for investors who purchased Bitcoin within the past 155 days and has historically acted as a decisive support or resistance level. A close above $80,700 would put $86,000 in play; a break of $74,000 opens $70,000.
For Ethereum, $2,250 is the line in the sand. Below that, $2,200 and then $2,100 come quickly into focus. Reclaiming $2,400 with volume is needed before bulls can credibly target $2,500.
Market outlook
Looking at the current stage of crypto market today, he setup is not outright bearish — April still closed as the strongest ETF inflow month since October 2025, BTC dominance is steady at 58%, exchange reserves are at multi-year lows, and Ethereum’s underlying demand metrics (treasury accumulation, taker buy/sell ratio, contract deployment) remain structurally constructive. But the short-term tape is fragile and weakening: ETF flows have now flipped negative for three straight days with breadth narrowing — every active BTC issuer redeemed on April 29 versus a counterweight inflow on April 28. Longs absorbed 80% of $345M in liquidations, oil is climbing past $104, and the Fear & Greed Index has dropped 14 points to 33.
The one constructive signal hiding in the data is XRP’s $3.59M ETF inflow against the broader red tape — a small but real divergence suggesting selective dip-buying still exists. The clean trade is to wait for either a BTC reclaim of $78,000 with rising spot volume (bullish continuation signal) or a flush below $74,000 that triggers another leverage reset (potential dip-buy zone). Until then, leveraged positioning is being punished from both sides.
Also Read: XRP Price Eyes 50% Rally to $2 As ETF Inflows Hit 2026 High