Bitcoin remains mired in a correction more than six months after hitting its record high, though fresh on-chain analysis suggests the market has yet to experience the kind of brutal washout that defined previous bear cycles.
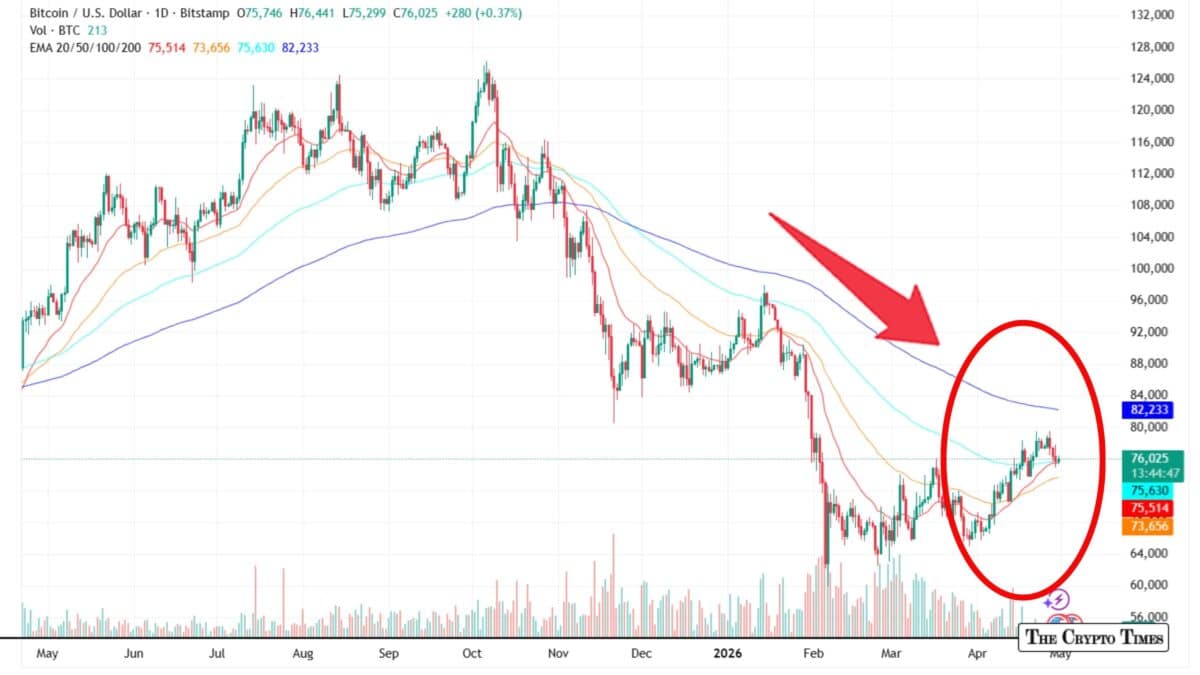
The cryptocurrency was trading hands around $76,000 on Thursday, putting it roughly 40% below the all-time high of approximately $126,198 reached on October 6, 2025. More than 206 days have passed since that peak.
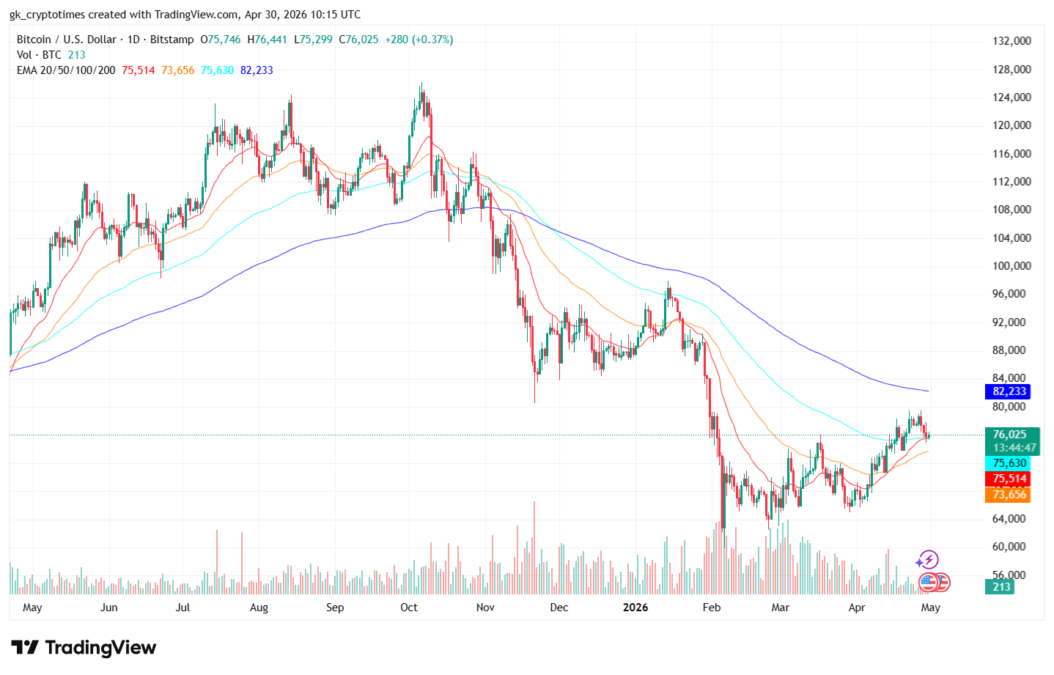
The daily chart shows a classic post-bull market correction: a sharp rally through mid-2025 that peaked in October, followed by a steep multi-month decline. After testing lows near $65,000 in March, price has stabilized in the mid-$70,000s, currently hovering just above its 20-day and 100-day EMAs while remaining well below the 200-day EMA at $82,233.
This price action aligns with on-chain observations from CryptoQuant, which noted the current retracement from its all-time high (ATH) remains significantly milder than the 76-86% crashes seen in previous bear markets. The shallower drawdown reflects growing institutional participation and maturing market structure.
However, the recovery remains fragile. Bitcoin has struggled to reclaim higher moving averages and faces resistance from the downtrend line established since the November peak. Volume has been muted during the recent bounce, suggesting limited conviction among buyers so far.
With macro uncertainty lingering, analysts will watch whether BTC can hold above $73,000 support or if another leg down is needed to fully reset the cycle. For now, the market sits in a tense consolidation phase.
Past cycle retracements
In a Quicktake report published this week, CryptoQuant analyst Zizcrypto highlighted how this drawdown stacks up against history. Past cycle bottoms came only after far more punishing declines: 86% in 2015, 83% in 2018, and 76% in 2022.
Those deep crashes cleared out weak positions and paved the way for the next leg up. “Past cycle lows formed after substantially deeper declines from peak levels,” the report noted. “More recent bear markets have generally bottomed with shallower losses… consistent with a gradually maturing market structure.”
The analysis includes a chart overlaying the current price path against prior cycles, with shaded “capitulation zones” that Bitcoin has so far avoided.
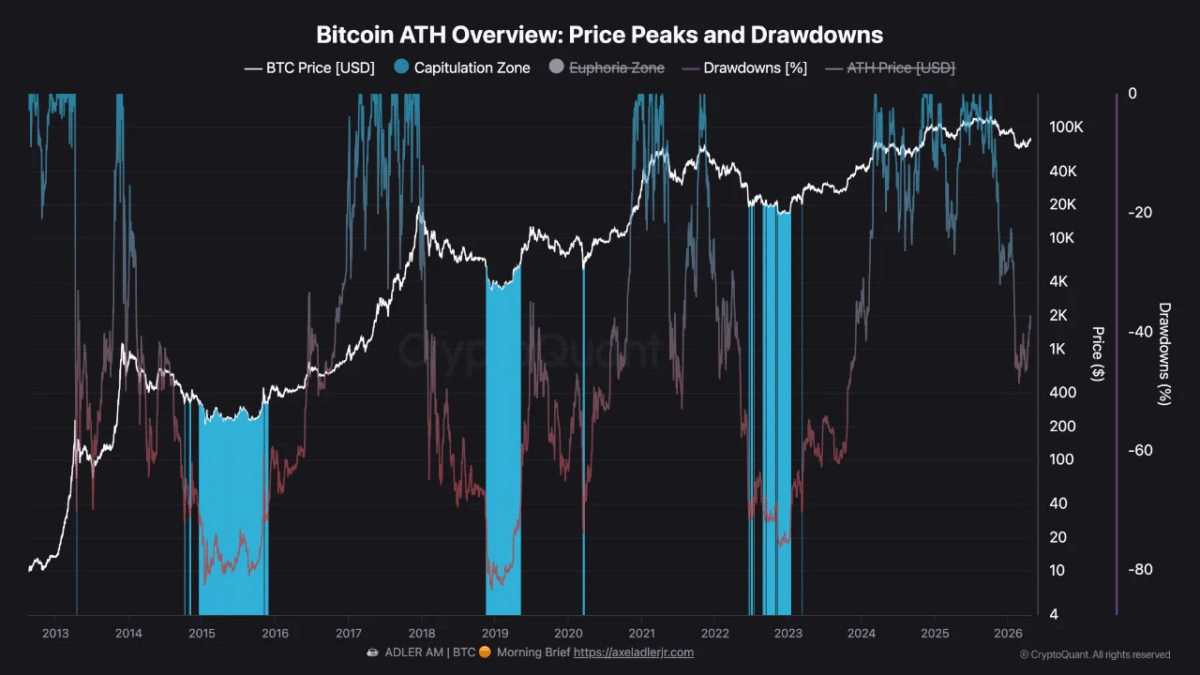
At -40%, the current pullback sits well above the extremes of earlier downturns. This pattern reflects bigger shifts in the Bitcoin ecosystem. Spot ETFs, corporate balance sheets, and institutional money have introduced new layers of demand and stability that were absent in the asset’s earlier, wilder days.
Still, the market isn’t immune to pressure. Periods of negative apparent demand have shown sellers outpacing buyers at times, and unrealized losses have mounted among shorter-term holders.
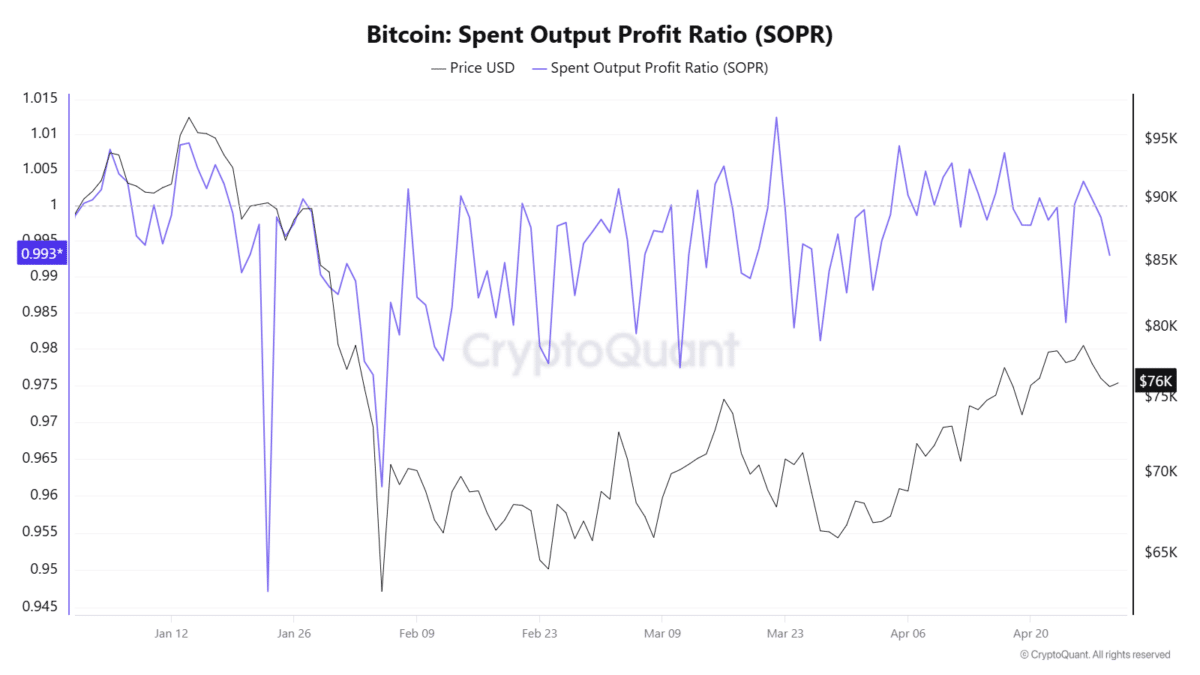
Some metrics offer glimmers of a floor forming. Certain cohorts of the Spent Output Profit Ratio (SOPR) have ticked above 1, hinting that parts of the market may be moving from outright pain toward stabilization. ETF flows, which fueled last year’s rally, have turned more volatile amid broader macroeconomic uncertainty.
Market veterans are split on the road ahead. Early investor Michael Terpin, sometimes called the “Crypto Godfather,” argued this week that Bitcoin hasn’t bottomed and sees little chance of a new all-time high in 2026. He flagged a potential low near $57,000 later this year.
Others point to the shallower drawdown as evidence that cycles are compressing as Bitcoin matures. A full capitulation toward $55,000–$60,000 isn’t off the table, but an 80% crash looks increasingly unlikely.
For holders watching their portfolios, the current environment feels heavy after 2025’s breakout highs. Yet the data tells a story of measured correction rather than outright despair. The real test will come in how demand holds up through the rest of 2026. History shows the strongest rebounds often follow only after the last of the panic selling exhausts itself.
Also read: Bhutan’s Quiet Bitcoin Exit: The Kingdom Has Sold 9,579 BTC So Far