Strategy’s aggressive Bitcoin strategy is paying off as its stock MSTR is already touching new highs with its highest monthly close. Alongside, MSTR stock price is also making history as it is also on road to close its highest monthly candle.
Further, bulls expect BTC price to see a strong action as it is also recording the highest monthly close. A wave of optimism has trickled down after Strategy stock and Bitcoin price showed an impressive synergy of bullish signals.
The MSTR stock gained over 6% today, hitting a peak of $407.39. At press time, the Strategy shares traded at $404.23, up by 5.30%. Further, the BTC ETF data shows a constant inflow for 2 weeks, suggesting a potential bullish build-up in the upcoming time.
Bitcoin ETF Records 14 Consecutive Days Of Inflow
As per the latest reading of SoSoValue, the BTC ETF has recorded only 3 negative trading days, while it has experienced 16 positive inflow days. Adding to this, with its positive trading day on 27th of June, it has recorded a 14-day inflow streak.
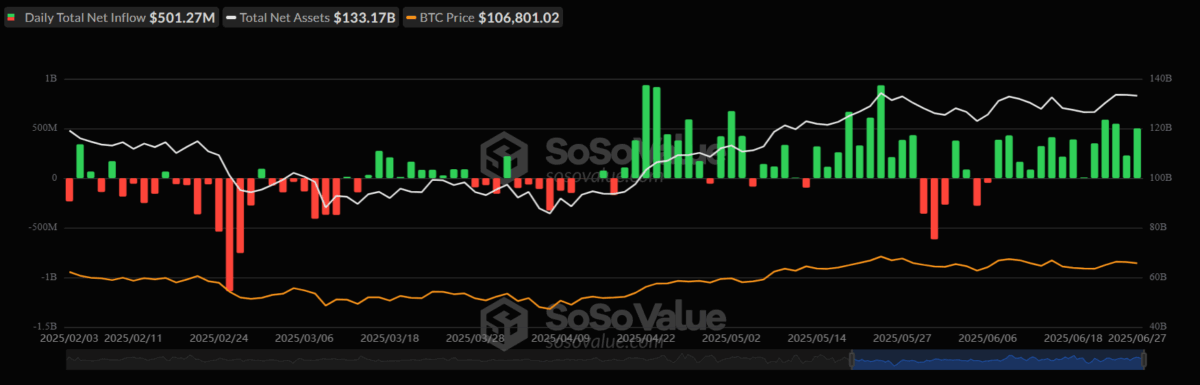
Notably, the highest inflow was recorded at $588.55 million on June 24, while the highest outflow was recorded on June 5 of $278.44 million. While this, the total netflow for the month of June concluded at +4,502.79 Bitcoins, making it another successful month for Bitcoin. Considering the market sentiments, let us now understand the short-term Bitcoin price prediction.
BTC Price Holds Its Major Support of $107,000
The Bitcoin price has formed a strong resistance zone just below its watch point of $109,631 in the daily time frame, suggesting a strong selling point around that range. However, it has maintained its value above the $107,000 level, resulting in it recording a consolidated price action.
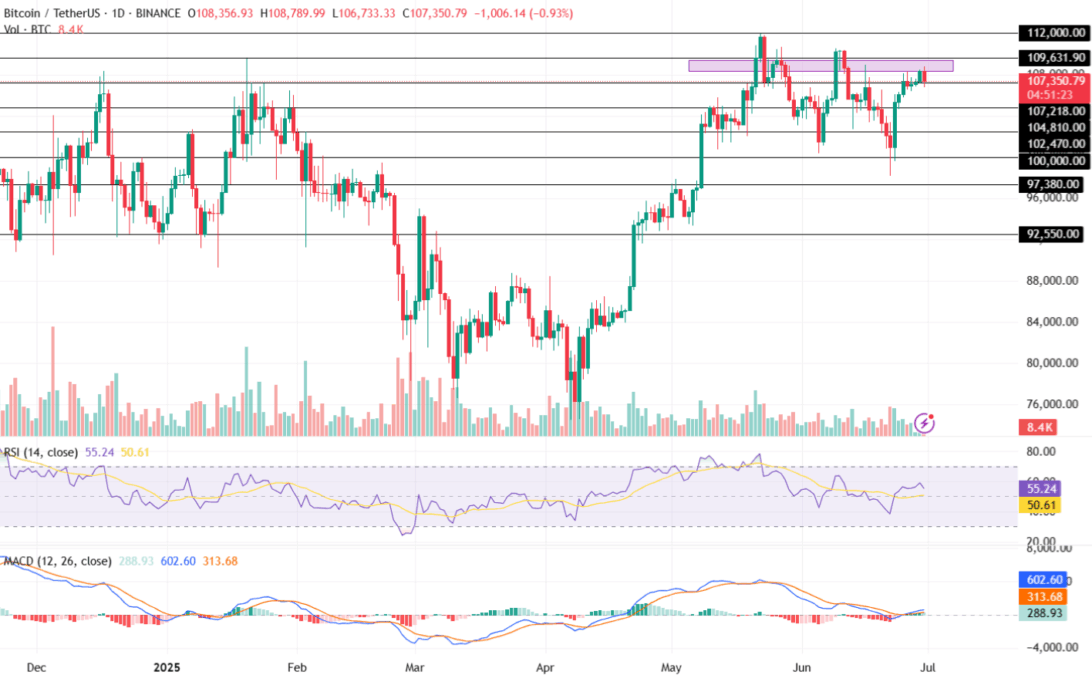
The RSI shows a drop and is valued at 55.24 (neutral) after recording a sideways action for a brief period, indicating a sudden increase in the selling pressure. Additionally, the average trendline hovers around the midpoint, indicating a weak bullish sentiment for the BTC price in the market.
The Moving Average Convergence Divergence (MACD) indicator records a fading trend in the green histogram as it is currently at 288.93. On the other hand, the 12 and 26-day averages are at 313.68 and 602.60, hinting at a rising negative action.
If the BTC price holds its value above its support of $107,218, this could result in it heading toward its upper price targets of $109,400 or $109,631, respectively. At that point, if the Bitcoin price rally intensifies, it may prepare to retest its ATH of $111,970 this month. On the flip side, bearish turnaround may pull the price of Bitcoin toward its low of $104,810 or important support of $102,470 within a short period.
Also Read: Senator Lummis Raises Voice For Bitcoin Miners: Stop Double Tax