Bitcoin (BTC) is at a crucial turning point as it hovers around $103,600, with technical signals pointing to a possible sideways consolidation or a sharp breakouts $106K Breakout or $90K Dip Ahead
Chart analysis suggests that the price has taken support on both the daily and 4-hour timeframes, with Bollinger Bands (BB) showing a narrowing range, a classic sign of pushing the market sideways.
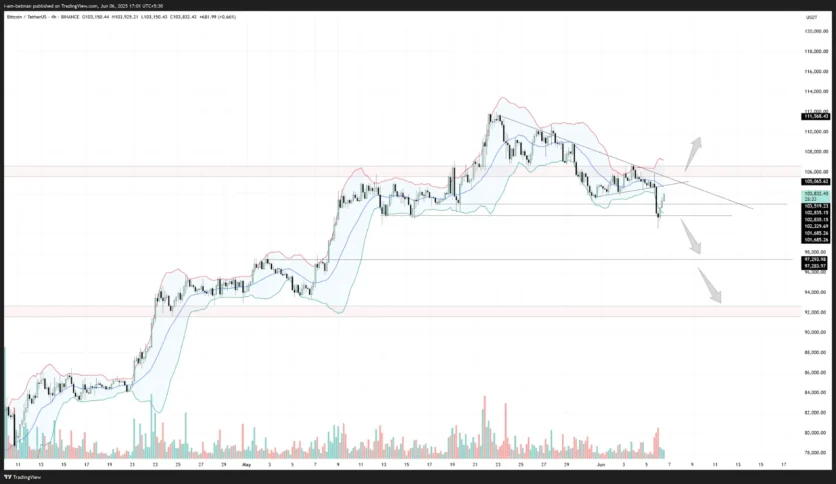
The Bollinger Bands indicate that Bitcoin is nearing the lower band, suggesting it is oversold in the short term. However, the lack of a decisive upward break above the mid-band means buyers are still hesitant. The market could be coiling up for a volatile move, with $106,000 acting as the upper resistance barrier.
If BTC manages a breakout above that level, it could signal bullish momentum. Failure to do so might confirm bearish continuation toward the $90,000 support zone.
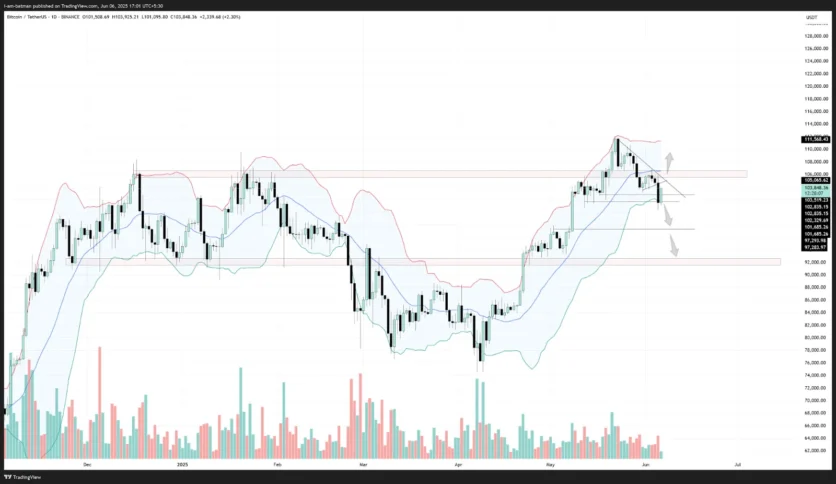
John Bollinger also said, that the bitcoin price rally is over. “A picture perfect ‘Three Pushes to a High’ Bollinger Band Pattern marked the end of this rally phase for $BTCUSD.”
With over $1 billion in recent liquidations and sentiment still cautious amid macro uncertainties, traders are bracing for a major move.