
Bitcoin closed at $83,640 on 13 October on the Binance daily chart reviewed for this story, after ranging between $81,033.66 and $84,168.00.
The chart, timestamped 13 October at 15:33 UTC+5:30, shows the daily candle with an open of $81,850.01, a high of $84,168.00, a low of $81,033.66, and a close of $83,640.01. The 20-period EMA sat at $83,204.83, the 50-period at $80,261.13, the 100-period at $76,503.16, and the 200-period at $75,610.32. RSI (14, close) read 53.50 and 57.62 on the two lines displayed.
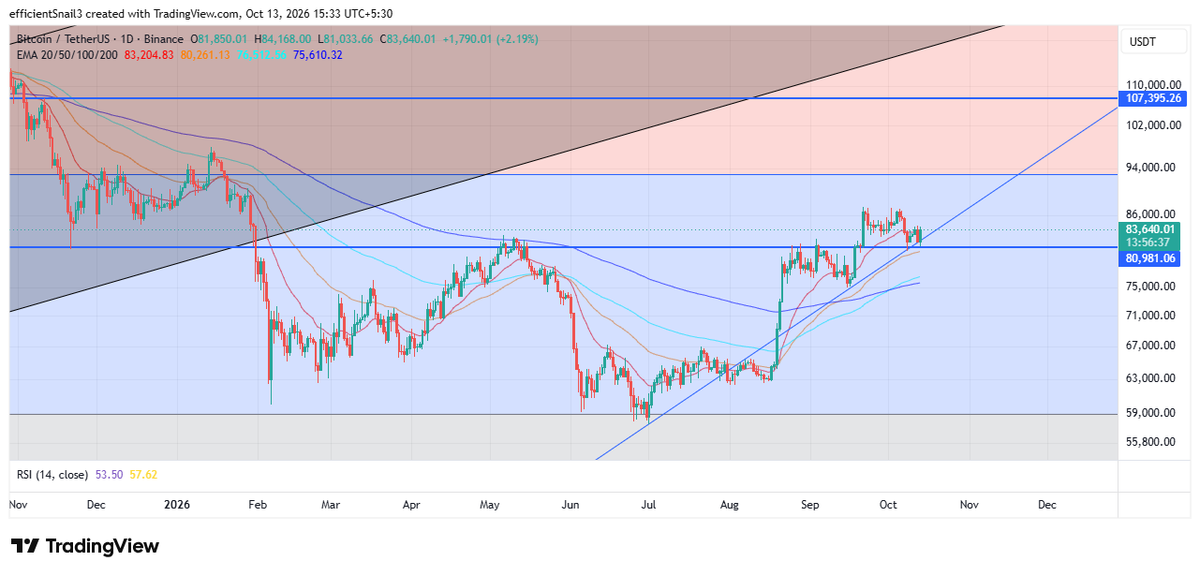
Price closed above the 20-period EMA and well above the 50-, 100-, and 200-period EMAs. A horizontal level near $80,981.06 is marked on the chart, with a higher line at $107,395.26. The session low of $81,033.66 tested the area just above that horizontal level before the recovery.
The structure on the daily chart is a recovery from the session low toward the middle of the recent range. The close remains below the early-October highs near $86,000–$87,000 and approximately 34% below the October 2025 high near $126,200 recorded across data providers. The 200-period EMA at $75,610.32 remains well below price. A close above $84,168.00 would place the session high behind the candle. A close under $81,033.66 would reopen the low of the session.
Dormat Wallet moves 4,581.93824 BTC
Long-dormat whale wallet 18VmXvkF4cgLi35RtMiHHDpvMjUCyVpQ9x sent 4,582 BTC to 5 different addresses in transaction fae42fe17f921bc4e887f9af9fbf92441e02bd8469904f8cfe8463caf6e9c4d2, confirmed on 12 October 2026 at 18:37:44 UTC. The balance after the transaction was 0.000232 BTC. The wallet received 4,581.947279 BTC on 3 March 2020 in transaction 8c4d97694f8cff45bf40ea89e46d45b8c477e6df8d4c9abb47aa49cb9942c9f7, when the coins were worth about $40.8 million.
The wallet transferred all 4,582 BTC, valued at $377.58 million at the time, to five addresses. Four addresses received 1,000 BTC each, and the fifth received approximately 582 BTC. Reports based on the same data said the coins remained in the recipient addresses and had not been identified as exchange deposits. A transfer between addresses is a recorded on-chain movement. It does not, by itself, confirm a sale or an increase in available supply on the open market.
The wallet had one prior outgoing transaction of 0.00904447 BTC on 7 August 2024. The 12 October transfer is the first material outbound movement since that date.
Coinbase Premium and institutional selling claims
CryptoQuant analyst Darkfost posted on 13 October that selling pressure from U.S. institutions and professional investors accelerated in October. He wrote that the Coinbase Premium Index has been deeply negative for several days, meaning BTC trades at a discount on Coinbase relative to Binance.
He described Coinbase’s professional platform as restricted to professional accounts and Binance as used by a broader set of investors and said the volume-weighted version of the index reduces noise by weighting larger transactions. He interpreted the reading as U.S. institutions selling more than retail investors on Binance, a pattern he linked to rising bond yields, persistent inflation, and a stronger dollar.
The post is an analyst interpretation of the premium index. It is not a direct measurement of institutional order flow or a confirmed list of sellers.
Polymarket odds for the 13 October noon ET close
Polymarket’s “What price will Bitcoin hit in October?” market, which resolves on 1 November, priced the chance of Bitcoin trading down to $80,000 during the month near 51–53% in snapshots reviewed on 13 October, while the probability of trading up to $85,000 stood near 55–82% across different readings. The probability of a move down to $77,500 was near 30% and the probability of a move up to $90,000 near 35%. These are the prices traders assigned to the outcomes.
Power-law model places current fair value near $99,000
The Crypto Times reported on 13 October that an unadjusted power-law formula first posted on Bitcointalk in 2013 continues to track Bitcoin’s long-term price path. The formula, originally posted by user dacoinminster on 13 February 2013, is Price = 4.41877086088824E-17 × (days since genesis)^5.59806919936792. Analyst Caffe’ extended the model in a post on X. The model assigns a current fair value near $99,000 as of 13 October. Bitcoin traded at $83,555 on CoinGecko at the time of that report, placing the spot price modestly below the line.
The same model projects $251,000 in 2030, $830,000 in 2035, $2.2 million in 2040, $5.1 million in 2045 and $10.6 million in 2050. Those figures are the middle of the long-term trajectory generated by the formula. They are a statistical description of historical price behavior, not a fundamental valuation or a forecast of future returns. Past adherence to the curve does not guarantee future adherence.
The Bitcoin Rainbow Chart on BlockchainCenter placed Bitcoin in the “Basically a Fire Sale” band as of 13 October, which the site labels as a buy signal. The chart is a dynamic power-law regression fitted to Bitcoin’s price history since 2012. At the time of the reading, the site showed a deviation of –62.3% from the model center, with Bitcoin 21 days into the band against an average of 31 days.
Range and prior levels
Bitcoin had traded back above $84,000 on 12 October, as The Crypto Times reported, before the subsequent pullback through $82,000 and the recovery to the mid-$83,000s. The 13 October low of $81,033.66 on the reviewed chart sits below the prior session’s close. The recovery from that low to the $83,640 close is a partial retracement of the session range. It has not closed above the $84,168 high of the day.
U.S. spot Bitcoin ETFs recorded a net outflow of $65.4 million on 12 October, according to Farside Investors. That single-day figure follows a series of mixed sessions earlier in the month. Cumulative net inflows across the products stood at $57.112 billion on the same table as of the latest update. The 12 October outflow is smaller than the multi-day stretches recorded in prior weeks, but it is the most recent completed print. A net outflow removes a buyer that had been present on inflow days. It does not, by itself, set the spot price. The cumulative total remains positive by a wide margin.
CoinGlass showed $193.5 million in Bitcoin liquidations in the 24 hours ending around 06:03 UTC on 13 October. Long positions accounted for $143.2 million, or about 74% of the total, while short positions accounted for $50.4 million, or about 26%. The largest single liquidation in the window was $9.7 million. The 24-hour total was 1.66 times the 7-day average and 0.31 times the 30-day peak. The peak hour for liquidations in that window was 21:00–22:00 UTC on 12 October. Long liquidations occur when leveraged positions betting on a price rise are forcibly closed after the market moves lower. The concentration of long liquidations in the 24-hour total is consistent with the overnight dip toward $81,000 recorded on the Binance chart, followed by the recovery into the mid-$83,000s.
What the levels leave open
The timestamped levels on the reviewed chart are the 13 October low of $81,033.66 and the close of $83,640.01. A sustained hold above $84,168.00 would place the session high behind price. A close under $81,033.66 would reopen the low of the session. The 200-period EMA at $75,610.32 remains well below price. Bitcoin remains approximately 34% below its October 2025 high near $126,200.
Also Read: Ethereum Price Today: ETH Jumps Above $2,500 After 10th Straight ETF Outflow