
Key Highlights
- 69.2% of 2.9 million human-paced Polymarket accounts finished below break-even, with the group down $338.9 million in aggregate.
- After a loss, 15.2% of accounts did not open another position within 30 days, compared with 6.1% after a win.
- 44.1% of traders concentrated more than 60% of their activity in a single topic.
Galaxy Research analyzed the trading behavior of 2.9 million human-paced Polymarket accounts, finding that most finished below break-even. The study also examined how results differed across market specialization, position size, and trading behavior.
According to the report published on October 1, the research uses Polymarket’s public on-chain settlement data, indexed and delivered by Stork. Galaxy said the international platform has matched 1.27 billion orders across 3.07 million wallets, representing $82.8 billion in notional volume since its 2020 launch.
The analysis focuses on accounts that trade at a human pace rather than the platform’s entire trading population.
69.2% of accounts finished below break-even
Galaxy found that 69.2% of the 2.9 million accounts in its analysis finished below break-even. The group recorded a combined loss of approximately $338.9 million. The median account was down about $3, while half of the accounts fell between a loss of $36.64 and a gain of $0.40.
The distribution was wider at the extremes. The bottom 1% lost at least approximately $4,804, while the top 1% gained at least $3,381. On a relative basis, the median account lost roughly 0.5% of the amount it committed over its trading history.
Galaxy calculates profitability by comparing the value of positions at settlement with their original cost. This includes positions that expired worthless rather than counting only amounts that users ultimately redeemed.
Automated accounts drove most order activity
Galaxy excluded 125,429 accounts, or 4.1% of the total, after applying a threshold of more than 50 orders per active trading day. Although these accounts represented a small share of the population, they accounted for 80.8% of orders and 41% of total notional volume.
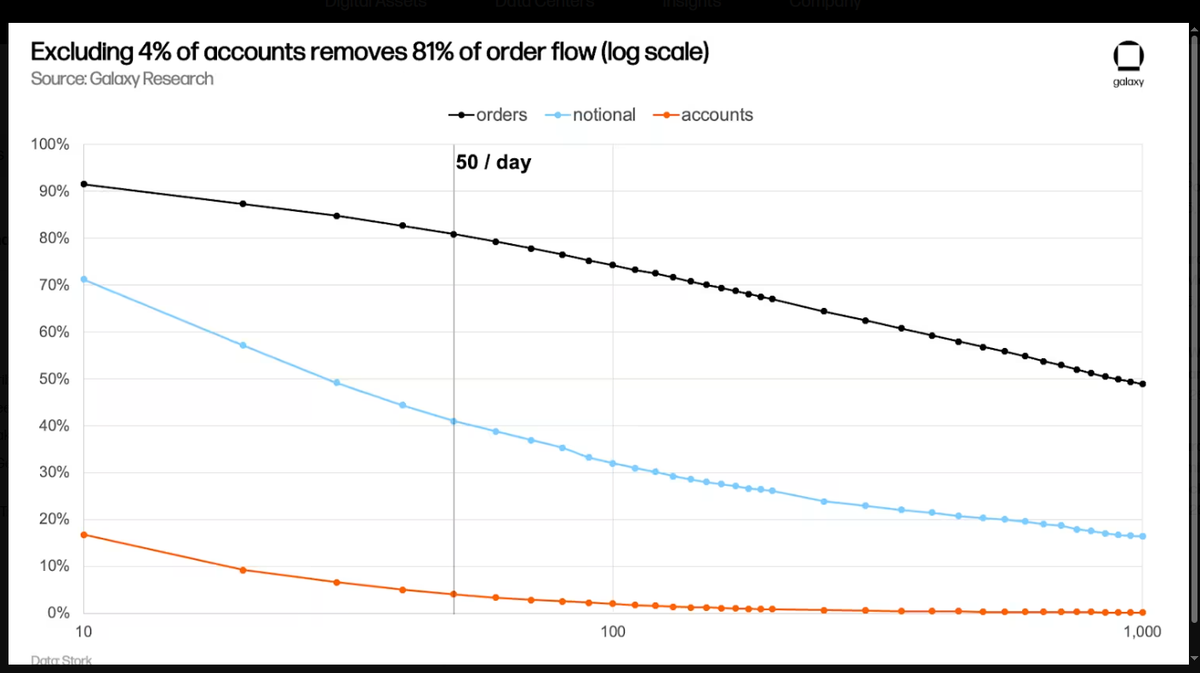
Chart showing that excluding about 4% of Polymarket accounts | Source: Galaxy
The excluded group recorded an aggregate gain of approximately $246.8 million. Galaxy said the group included accounts involved in trading rewards, market making, and arbitrage.
This distinction matters because the study’s main findings describe human-paced trading rather than all activity on Polymarket. Galaxy’s use of the term “retail” is based on trading frequency, not income, wealth, or investor classification.
Trading activity fell more often after losses
The study examined what happened after winning and losing positions. After a winning position, 6.1% of accounts had not opened another position within 30 days. Following a loss, that figure rose to 15.2%.
Galaxy therefore found a higher rate of apparent inactivity following losses.
There is a limitation to this finding. The analysis tracks wallet addresses rather than verified individuals, so a trader who moves from one wallet to another could appear to have stopped trading.
Position size depends on outcome and entry price
Galaxy also examined whether traders changed the size of their next positions after winning or losing. In the raw data, 46.6% of positions following wins were larger, compared with 50.2% following losses. The comparison was affected by entry prices. Losing positions had a median entry price of $0.43, compared with $0.86 for positions that later won.
After controlling for entry-price bands, traders who had won were more likely to increase their position size when the entry price was above $0.50.
Galaxy also examined expected downside rather than simply the amount of capital committed. Risk generally declined after both wins and losses, although traders reduced risk less frequently following wins.
44.1% of traders specialized in one topic
Galaxy classified 44.1% of traders as specialists, meaning more than 60% of their activity was concentrated in one topic across at least five categorized markets. The remaining 55.9% were classified as generalists.
The researchers grouped markets into 10 broad categories, including crypto, sports, politics, finance, economy, weather, culture, world, technology and science, and business.
Overall, 28.1% of specialists were profitable, compared with 30.4% of generalists.
Profitability differed across individual topics.
Sports specialists had the lowest profitability
Sports accounted for 47% of specialist traders, making it the largest specialist category. Only 25.1% of sports specialists were profitable, the lowest rate among the topics analyzed. Finance specialists had a profitability rate of 36.8%, while technology and science specialists recorded 41.2%.
Galaxy noted that technology and science represented a smaller category than some of the others. Specialists also traded a median of 18 markets, compared with four for generalists.
The differences show an association between topic specialization and profitability, but the study does not establish why some categories performed differently.
Profitable traders had larger median positions
Galaxy found a difference in typical position size between profitable and unprofitable accounts. The median position for profitable traders was $13.96, compared with $10 for unprofitable traders. Among traders who had opened five to nine positions, the median position was $12.53 for profitable accounts versus $7.05 for unprofitable accounts.
For traders with 50 to 99 positions, the figures were $13.14 and $8.90, respectively.
Galaxy cautioned that profitable traders also tended to trade more frequently, meaning the relationship between position size and profitability could partly reflect differences in overall activity.
Holding time produced a less consistent result. Across the full sample, profitable traders had a median holding period of roughly 20 hours, compared with about 25 hours for unprofitable traders.
The relationship changed across activity levels, so Galaxy did not identify a consistent connection between holding time and profitability.
Fees add another trading cost
Galaxy also examined Polymarket’s fee changes during 2026. Taker fees were introduced for crypto price-direction markets in January and expanded across nearly all categories by the end of March.
For a $50 even-odds crypto position, Galaxy calculates that the taker fee represents approximately 3.5% of the capital committed. Politics, finance, and technology markets had lower rates, while sports stood between them.
Because the fee structure changed during the period covered by the research, Galaxy does not treat fees as a direct explanation for the overall profitability results.
Galaxy’s earlier onchain research
The Polymarket study is part of Galaxy’s broader on-chain research.
In August, Galaxy estimated that the Coldcard entropy exploit had affected 8,865 addresses, with identified losses totaling 1,789.28 BTC, worth about $114.7 million based on Bitcoin prices at the time.
At the time, Galaxy said 221 reported victims accounted for 790.72 BTC, or approximately 44.2% of the identified losses. The wider estimate included additional addresses identified through blockchain analysis.
The Coldcard investigation was separate from the Polymarket study, but both used blockchain transaction data to examine activity across large numbers of addresses.
The study covers Polymarket’s international platform
Galaxy’s analysis applies specifically to Polymarket’s international platform, which operates separately from its U.S. exchange. The two venues have separate order books and regulatory structures.
The study also relies on wallet addresses rather than verified identities. Users operating multiple wallets may therefore appear as multiple accounts, while automated accounts are removed using a trading-frequency threshold.
These limitations mean the findings describe activity within the dataset rather than providing a complete measure of individual performance across prediction markets.
What the data shows
Galaxy’s analysis found that most human-paced Polymarket accounts finished below break-even, while a relatively small automated cohort accounted for most orders and a substantial share of notional volume.
The research also found differences in profitability across market categories and trading behavior, with sports specialists recording the lowest profitability rate among the categories examined.
The findings are associations within Polymarket’s historical on-chain data rather than evidence that a particular position size, holding period, or market category causes better results.
Because the analysis is based on wallet addresses and covers Polymarket’s international platform, the results provide a snapshot of trading behavior within that dataset rather than a measure of individual investor performance across the broader prediction-market industry.
Also Read: CRS Examines What Crypto Activities U.S. Banks Can Conduct