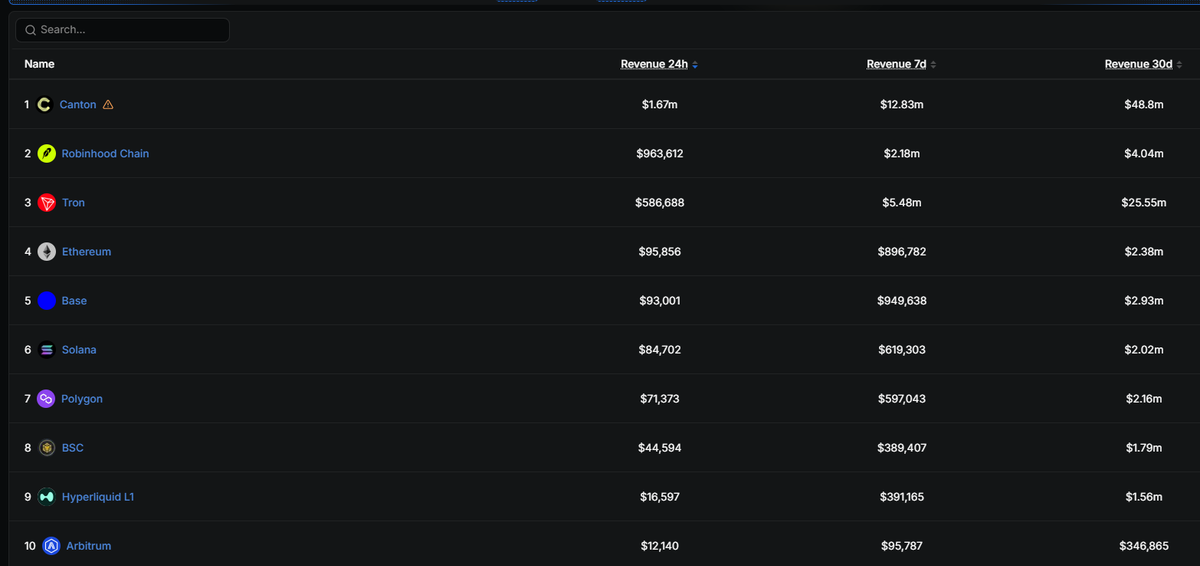
Robinhood Chain, the Ethereum layer-2 network operated by Robinhood Markets and launched on mainnet in July 2026, ranked first among Ethereum scaling chains and second among all networks tracked by DeFiLlama for 24-hour chain fees in a dashboard snapshot dated August 31.
DeFiLlama data as of 12:45 PM UTC shows that users paid about $1.07 million in gas on the chain over the rolling window. After Ethereum data-availability costs and a contractual share paid under Arbitrum’s Expansion Program, DeFiLlama recorded about $963,612 in retained chain revenue.
The same dashboards placed Coinbase’s Base at about $93,000 in 24-hour fees and Arbitrum One at about $12,000. Ethereum mainnet recorded $95,856 in fees over the same window; a revenue-by-chain view circulating the same day listed Ethereum’s retained 24-hour figure far below Robinhood Chain’s.
Those comparisons are not a judgment of security, settlement volume, or long-run economics. They describe one rolling day of fees as DeFiLlama defines them.
What the fee and revenue tables measure
DeFiLlama publishes two related chain series. “Fees” are amounts users pay. On Robinhood Chain that line is defined as transaction gas in ether (ETH), covering layer-2 execution and the layer-1 data component posted to Ethereum. “Revenue” is what remains after costs and revenue share. For this chain, DeFiLlama defines revenue as gas net of Ethereum execution and blob costs and net of the 10% Arbitrum Expansion Program fee share.
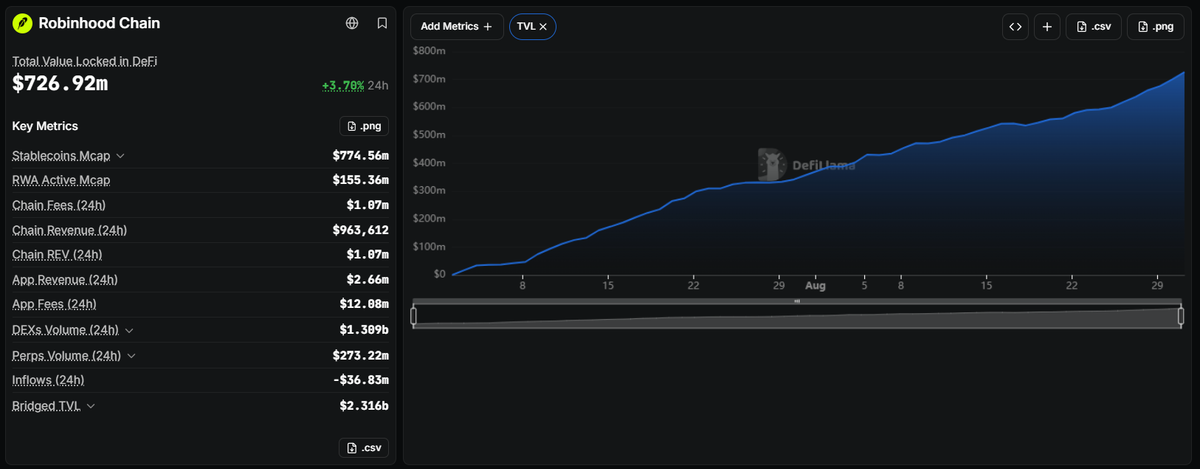
A third series, application fees and application revenue, counts what protocols on the chain collect from traders. On the chain page, DeFiLlama showed about $12.08 million in 24-hour app fees and $2.66 million in 24-hour app revenue, led by trading venues and launchpads rather than by the sequencer line alone. Mixing those series produces different rankings. App revenue can exceed chain gas; chain gas can exceed what the operator keeps.
The following figures are DeFiLlama 24-hour readings as of the August 31 snapshot used for this report. Seven- and 30-day columns on the same pages still show Canton, Tron, Solana, and Ethereum ahead of Robinhood Chain over longer windows.
Independent L2 usage data from GrowthePie, timestamped August 31 UTC, put Robinhood Chain first among tracked Ethereum layer-2s by daily throughput (31.2 million gas per second) and daily transactions (11.84 million). Base led the same leaderboards on weekly and monthly transaction counts.
Daily active addresses on GrowthePie placed Celo and Robinhood Chain at the top of that day’s list, with Base leading the monthly unique-address count. Throughput is harder to inflate than raw transaction count; both remain short-horizon activity measures.
How the stack splits the proceeds
Robinhood Chain is an Arbitrum chain: a configurable instance of the Nitro stack that executes off Ethereum and posts data back to it for availability and settlement. Official Arbitrum documentation describes such chains as child chains that can run as layer-2s settling to Ethereum. Gas on Robinhood Chain is paid in ether (ETH).
The fee split is contractual, not a hidden leak. The Arbitrum Expansion Program, described on the Arbitrum DAO forum when the program launched, requires participating Orbit-style chains to share 10% of chain profit with the Arbitrum ecosystem—8% to the DAO treasury and 2% to a developer guild.
DeFiLlama’s Robinhood adapters follow that structure: the chain line is net of the share; a separate Arbitrum Foundation line records the remittance (about $85,654 in 24-hour revenue and $107,068 in 24-hour fees on the chain breakdowns).
Ethereum itself does not levy an equivalent percentage tax; it collects the blob and execution costs of posting data. Those L1 costs are small relative to L2 gas in the current snapshot, which is why retained chain revenue sits close to gross fees.
DeFiLlama’s Robinhood Chain overview for August 31 listed about $727 million in DeFi total value locked, $775 million in stablecoins, $1.31 billion in 24-hour decentralized-exchange volume, and $155 million in active real-world-asset market cap. Uniswap, Pons, and GMGN accounted for most application fees in the 24-hour protocol tables on the chain.
Read: Uniswap Robinhood Chain Volume Reaches $130M All-Time High
Limits of a one-day ranking
On a foundational note, a 24-hour lead in gas fees is a utilization print, not a franchise valuation. Rolling windows move as new blocks enter and old ones drop out. Robinhood Chain’s 30-day chain fees ($4.51 million) and chain revenue ($4.04 million) remain a fraction of Ethereum, Tron, or Solana on the same DeFiLlama pages.
Base still processes more weekly and monthly transactions on GrowthePie. Hyperliquid’s protocol-level derivatives revenue, tracked separately by DeFiLlama, is not comparable one-for-one with an L2 gas line.
The snapshot also says little about who pays. High fee totals on a low per-transaction gas market usually mean high throughput, often including bots and launchpad flow, rather than expensive user tickets. Official chain documentation describes fees as an L2 execution component plus an L1 data component that scales with calldata. That structure can produce large aggregate fees while keeping a simple transfer cheap.
Nor does the ranking settle the longer argument about whether Ethereum “captures” L2 activity. In this model Ethereum sells security and data availability at posted blob and execution prices; Arbitrum licenses the stack for a percentage of net chain profit; the operator keeps the residual sequencer margin. Each layer is priced. Whether that split is durable is a policy and market question, not something a single dashboard row can answer.
Also read: Polygon Patched Three DoS Vectors in PoS Clients Before Disclosing Them