Key Highlights
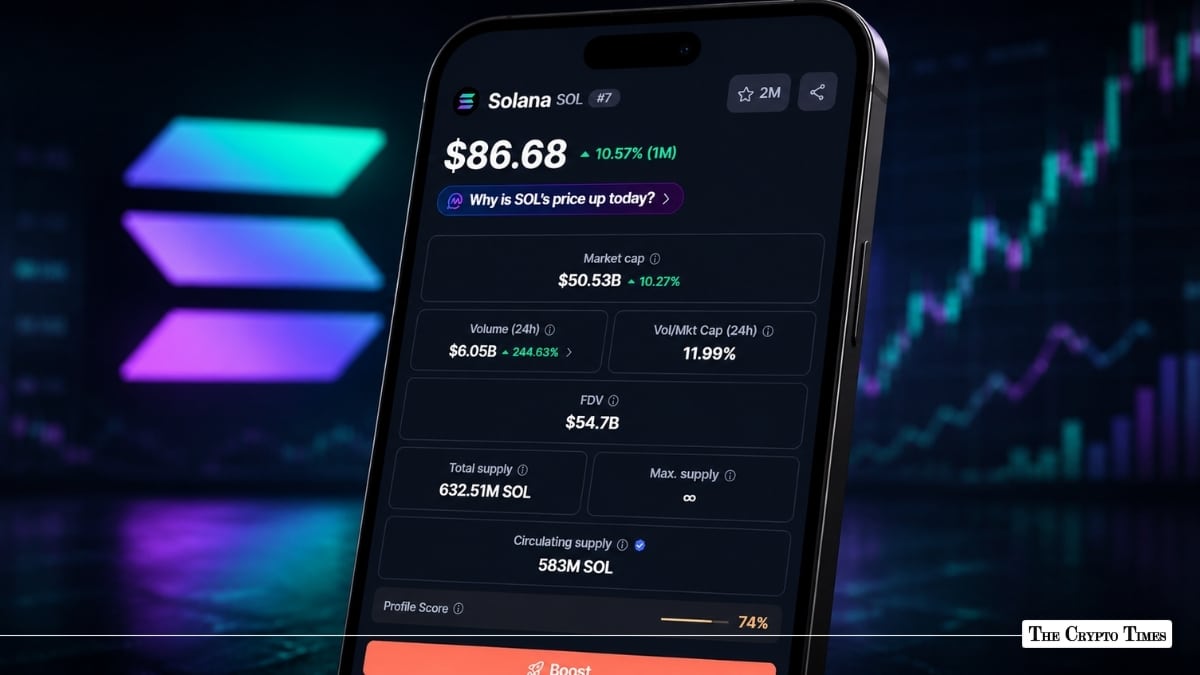
- Solana surged 10.4% in 24 hours to $86.67 on August 20, while its seven-day gain reached 13.8%.
- SOL’s market capitalization rose to $50.55 billion, with 24-hour trading volume reaching $5.69 billion.
- The rally coincided with a broader crypto market recovery and increased activity across major digital assets.
Solana (SOL) surged 10.4% in the past 24 hours to trade at $86.67 on August 20, extending its seven-day gain to 13.8% as the broader cryptocurrency market recovered.
According to the data from CoinGecko (on Aug 20 at 1:45 pm UTC), SOL stood between $78.33 and $87.97, while the seven-day range extended from $74.20 to $87.97. Market capitalization reached $50.548 billion, with fully diluted valuation at $54.841 billion, and 24-hour trading volume totaled $5.693 billion.
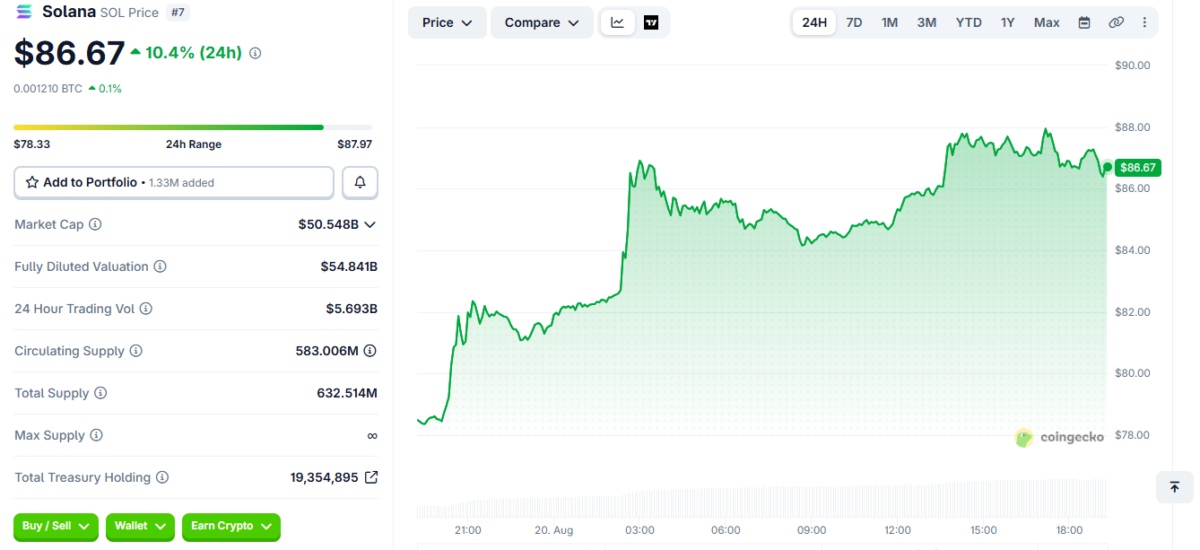
The circulating supply was reported at 583.01 million SOL, the total supply at 632.51 million, and the max supply listed as unlimited. Total treasury holdings stood at 19,354,895 SOL.
SOL’s 24-hour price chart showed a rise from around $78 before the token moved toward the session high near $88. The seven-day chart showed a more gradual advance through mid-August, followed by a sharper move on August 19 and 20.
SOL remains well below its January 19, 2025, record high of $293.31. At the reported price, the token was about 70.5% below that peak.
Why is SOL token up?
The move came alongside a wider recovery across crypto markets, with Bitcoin and Ethereum also posting gains on August 20.
Major cryptocurrencies recorded gains amid a broader market advance. Bitcoin and Ethereum both posted positive daily returns, contributing to elevated trading volumes across exchanges. Market data showed increased activity in large-cap tokens, with several assets reaching multi-day highs.
The rally followed the Securities and Exchange Commission’s August 18 proposal of Regulation Crypto Assets, which outlined new exemptions and a conditional safe harbor for certain crypto investment contracts.
The proposal aims to establish a framework for certain investment contracts involving crypto assets. It follows a March 2026 interpretation clarifying the application of federal securities laws to specific crypto assets and related transactions.
What do technical indicators indicate
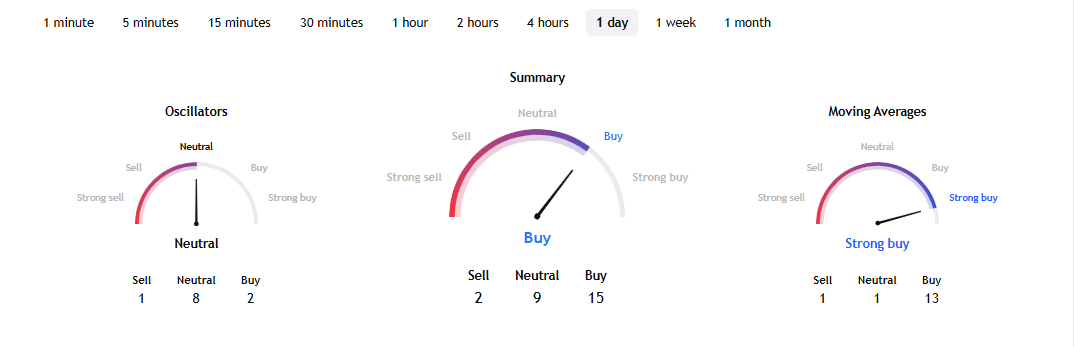
Technical summary data for the one-day timeframe showed oscillators at neutral (1 sell, 8 neutral, and 2 buy), overall summary at buy (2 sell, 9 neutral, and 15 buy), and moving averages at strong buy (1 sell, 1 neutral, and 13 buy).
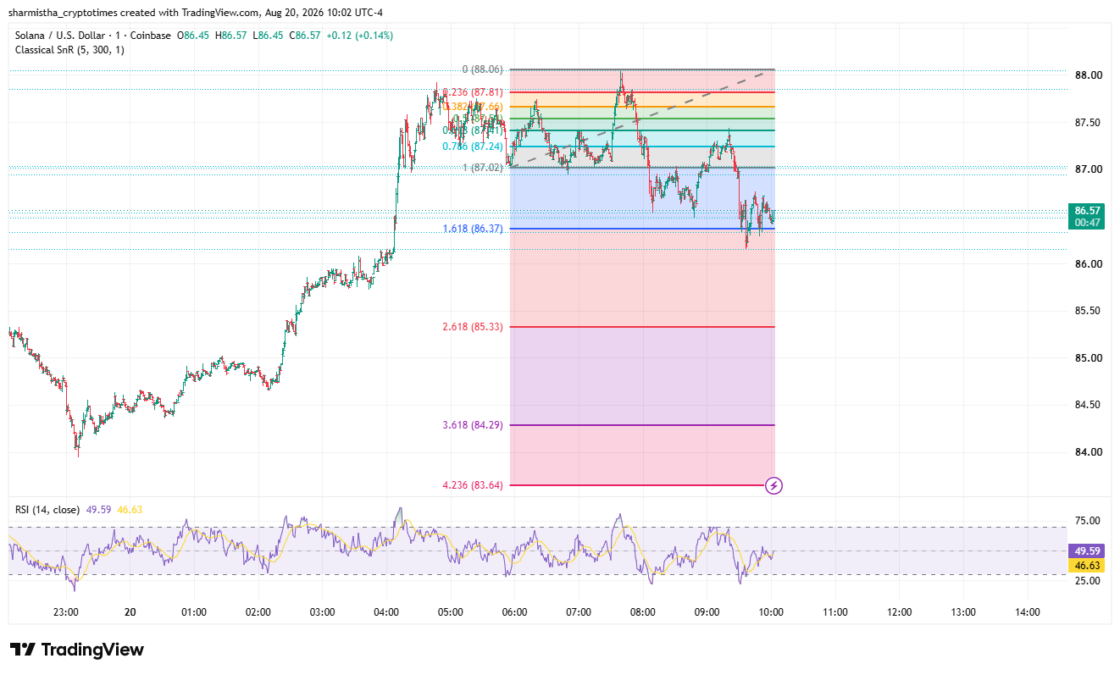
At the time of the chart, price action hovered near $86. Levels above the prevailing price, including 87.02, 87.24, 87.36, 87.51, 87.66, 87.81, and 88.06, marked successive resistance zones. Levels below, such as 86.37, 85.33, 84.29, and 83.64, indicated support areas.
The Relative Strength Index (RSI 14, close) registered a reading of 49.59, positioning it in the neutral zone between the conventional overbought threshold of 70 and the oversold threshold of 30.
Price action on the intraday chart reflected consolidation after earlier advances, with the token trading within the identified Fibonacci structure.
Also Read: Altcoin Market Cap Crosses $1 Trillion as ETH, SOL, XRP, and ZEC Rally 7-10% in Hours