Key Highlights
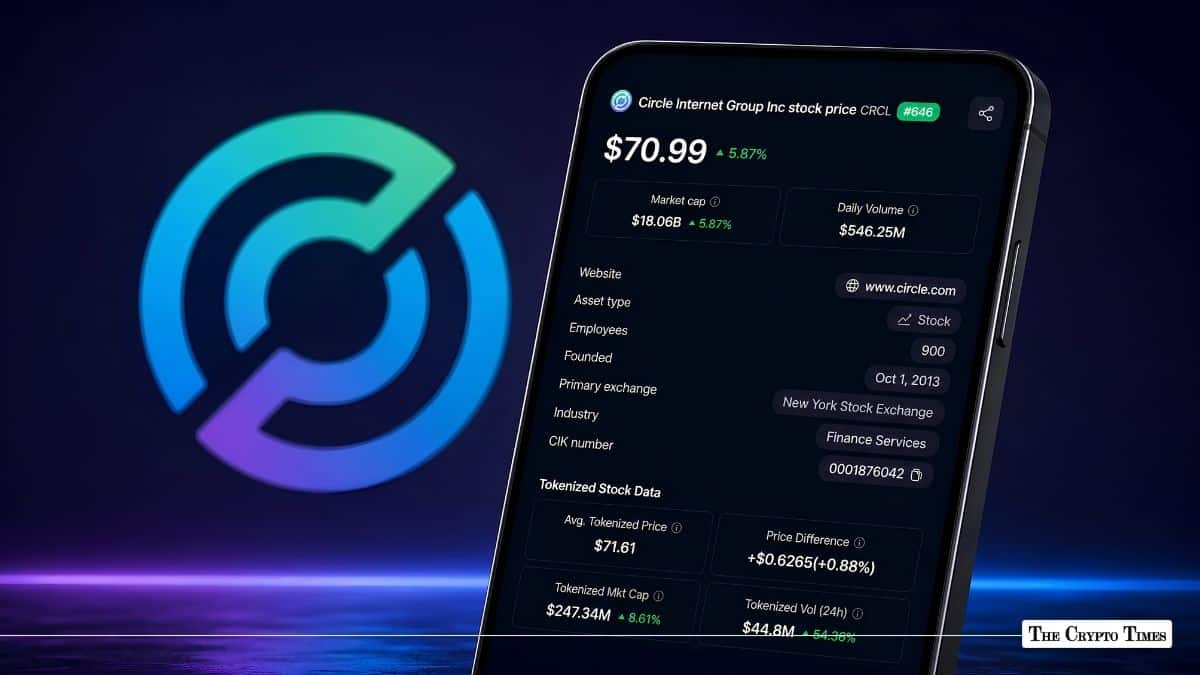
- Circle stock rose 6% to $71.11 after reaching $73.35.
- CRCL has recovered from its recent low of $57.84 following the Q2 earnings sell-off.
- $72.50 is now a key resistance level, with a break above it potentially pushing the stock higher.
Circle stock (CRCL) rose nearly 6% on Tuesday, trading at $71.11 as of the time of reporting. The shares reached an intraday high of $73.35 before pulling back.
The move pushed Circle’s market capitalization to about $19.41 billion, while its average daily trading value stood at around $13.9 million.
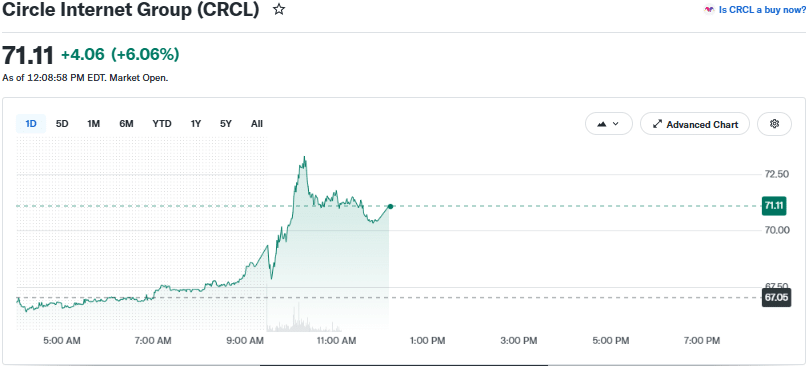
Back above $71 after Q2 results
The latest gain comes days after the stock fell below $60 following the company’s second-quarter results released on August 5. Circle reported earnings per share of $0.18, matching analysts’ expectations.
The company also raised its full-year revenue outlook and pointed to the approval of its U.S. national trust bank charter as an important development.
The initial gains in the stock did not hold. The Crypto Times, at the time, reported that Circle shares fell more than 3% in early trading after first gaining about 7% in premarket trading. The stock reached a session low of $59.12 before recovering to around $61.20 at the time of the report.
Circle’s USDC business keeps growing
The fall came even as Circle’s main stablecoin business continued to grow. USDC in circulation reached $73.3 billion at the end of the second quarter, up 19% from a year earlier.
Circle’s total revenue and reserve income rose 7% to $701 million, while adjusted EBITDA increased 8% to $143 million. Net income from continuing operations came in at $48 million. The company also highlighted its newly approved U.S. federal trust bank charter.
CRCL recovers from $57.84 low
Following the earnings-related decline, Circle shares fell to a corrective low of $57.84 before recovering.
Circle shares subsequently moved back above their 20-day moving average on Friday, with the full trading range remaining above that level. The shares also stayed above the moving average on Monday.
On the weekly chart, CRCL closed at $66.67 after reaching $57.84. That was above the previous week’s high of $66.24 and marked its highest weekly closing price in seven weeks.
RSI points to weaker selling pressure
At the same time, the stock’s Relative Strength Index, known as RSI, on the daily chart also shows a bullish divergence build-up. This means the price was making new or similar lows while the momentum indicator was showing signs of less downward pressure.
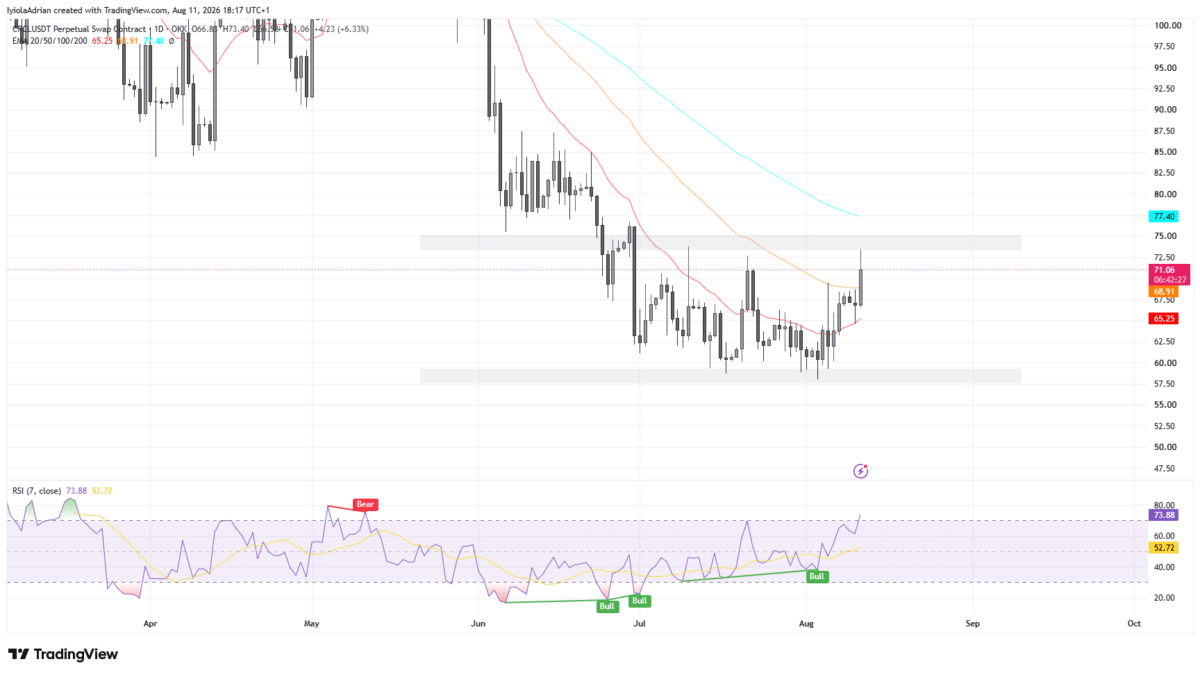
Now, the stock is approaching a key resistance level at $72.50. The daily chart shows that the price remains below this area after several attempts to move higher, making it an important level to watch.
A decisive move above $72.50 could signal further upside if buying momentum continues. If the stock fails to clear the resistance, the price could retest support near $60.
Also Read: eToro Stock (ETOR) Slides 8% Despite 77% Q2 Profit Jump