
Bitcoin is holding firm near the psychologically important $60,000 level after a volatile June that saw sharp sell-offs, elevated trading activity, and significant liquidations. As of early June 30, Bitcoin (BTC) trades in a tight range around $59,000–$60,500, down 20% in the past 30 months while showing clear signs of stabilization following a mid-month flush.
Data from recent price-volume and liquidation charts reveal a notable cooldown in market activity. The intense selling pressure that defined the June 25 drop has subsided, with both futures and spot volumes retreating from their peaks and liquidation volumes tapering significantly.
This shift points to a market transitioning from acute stress into a more measured consolidation phase rather than remaining in the throes of full-blown capitulation.
Price Action: From Sharp Decline to Range-Bound Stability
Bitcoin entered the final week of June under pressure. After trading in the mid-$60,000s earlier in the month, a swift sell-off around June 25 pushed prices toward $58,000–$59,000 intraday lows. This move coincided with broader risk-off sentiment across markets and renewed concerns about macroeconomic headwinds.
The subsequent recovery and stabilization near $60,000 represent a classic post-volatility pause. Price action has formed a tighter range, with support holding around $59,000–$59,500 and resistance emerging near $60,700–$61,000.
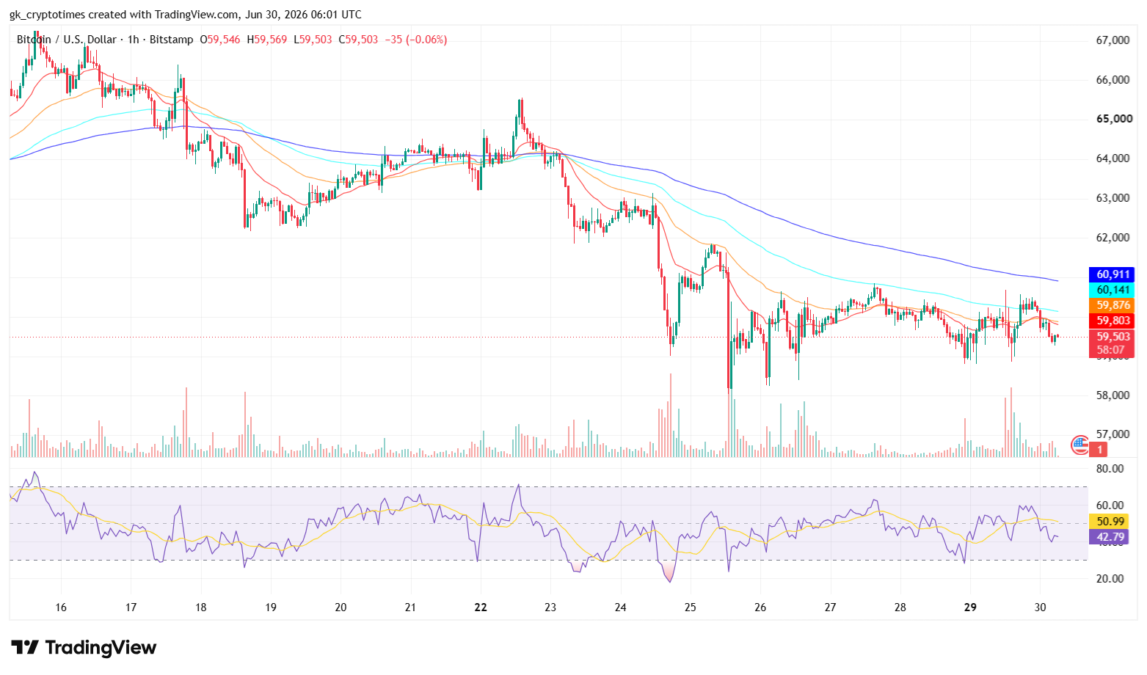
Technical observers note the formation of a symmetrical triangle pattern on shorter timeframes, suggesting a potential breakout, either upward toward $62,000–$65,000 or a retest of lower supports, once volume returns.
This stabilization comes after Bitcoin posted its lowest weekly close since September 2024, reinforcing the corrective nature of the move from 2025 highs. While some analysts flag the possibility of further downside toward the $50,000 zone before a cycle bottom, the immediate price behavior reflects exhaustion of aggressive selling rather than capitulation-driven freefall.
Volumes and Liquidations: Clear Evidence of Cooling Activity
The most compelling evidence of shifting dynamics comes from volume and liquidation data. The BTC Price vs Volume History chart spanning mid-to-late June shows prominent spikes in futures and spot volumes during the June 18–25 period, particularly the massive futures surge on June 25 that aligned with the sharp price drop.
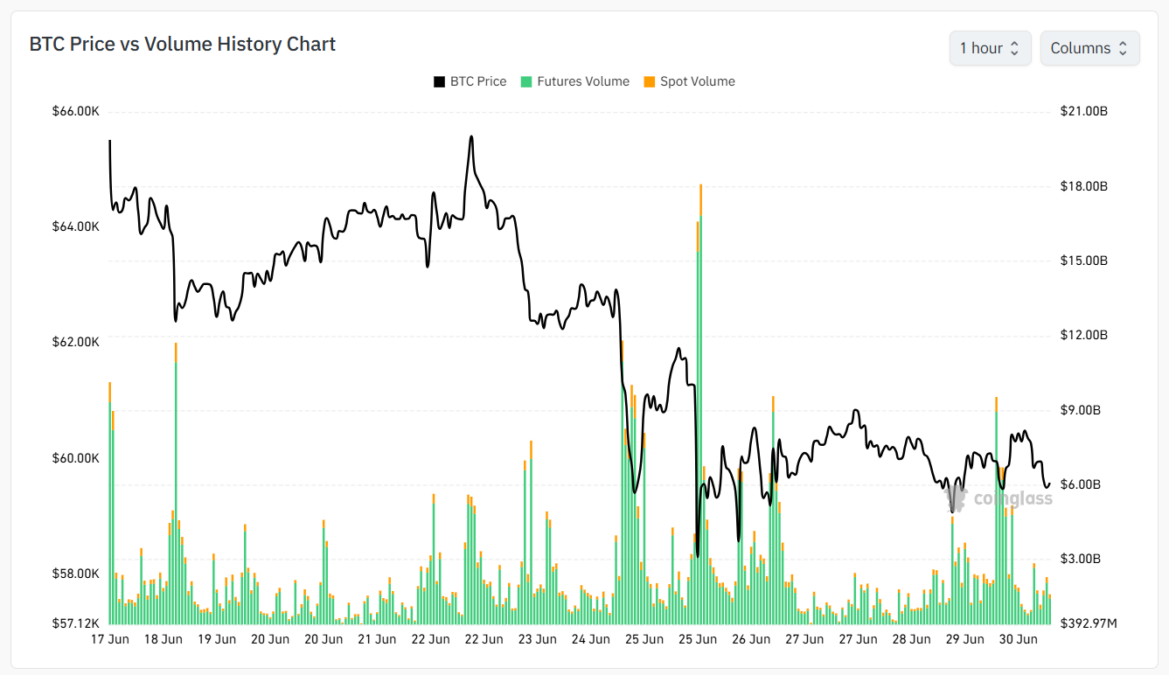
In contrast, the final days of the month (June 28–30) display noticeably smaller and more subdued volume bars. Both futures and spot trading activity has declined meaningfully from peak levels, indicating reduced participation from both speculative traders and leveraged players.
Liquidation history paints a similar picture. The 30-day BTC Liquidation chart from Coinglass reveals substantial long liquidations during earlier June stress periods and a notable cluster around June 25.
Short liquidations (red) remained more contained throughout. By June 27–29, however, both long and short liquidation volumes had contracted sharply, with no major cascades visible in the most recent sessions.
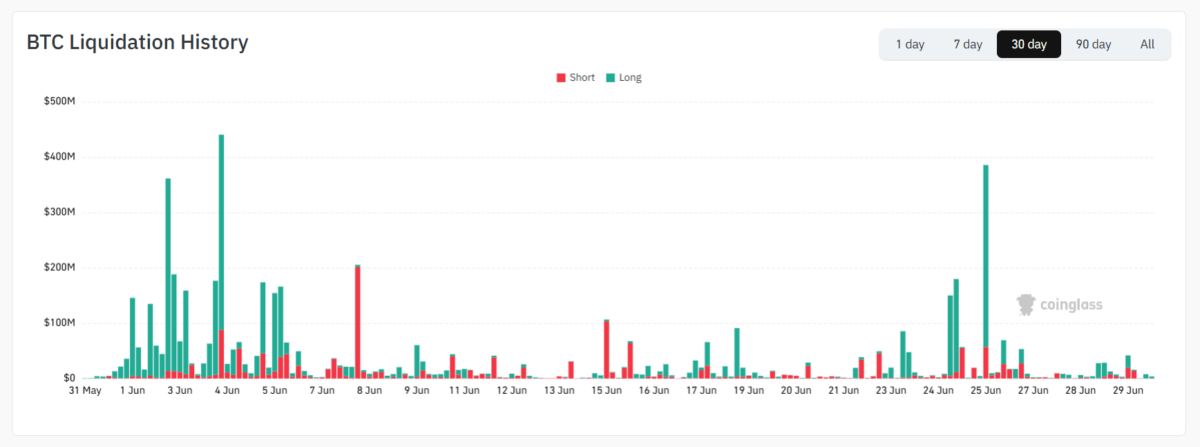
This cooldown is significant. High-volume liquidation events often signal capitulation or deleveraging exhaustion. When they subside while price holds support, it frequently precedes periods of range-bound trading or relief bounces. The current data suggests the leveraged long positions that fueled earlier volatility have largely been flushed, reducing the risk of immediate cascading liquidations.
Capitulation or Consolidation? Placing the Current Phase in Context
The June 25 move carried several hallmarks of a local capitulation event: a rapid price decline on elevated volume, heavy long liquidations, and widespread realized losses among recent buyers. On-chain metrics earlier in June also highlighted long-term holders realizing substantial losses and a high percentage of short-term holders sitting underwater—conditions historically associated with capitulation zones.
However, the subsequent behavior differentiates this from classic cycle-ending capitulation. True major bottoms are typically marked by prolonged extreme fear, persistently high (or climactic) volume during the final flush, and a more violent, one-sided sell-off that clears out even strong hands. Here, the intensity peaked and then quickly moderated as price found footing near $60,000.
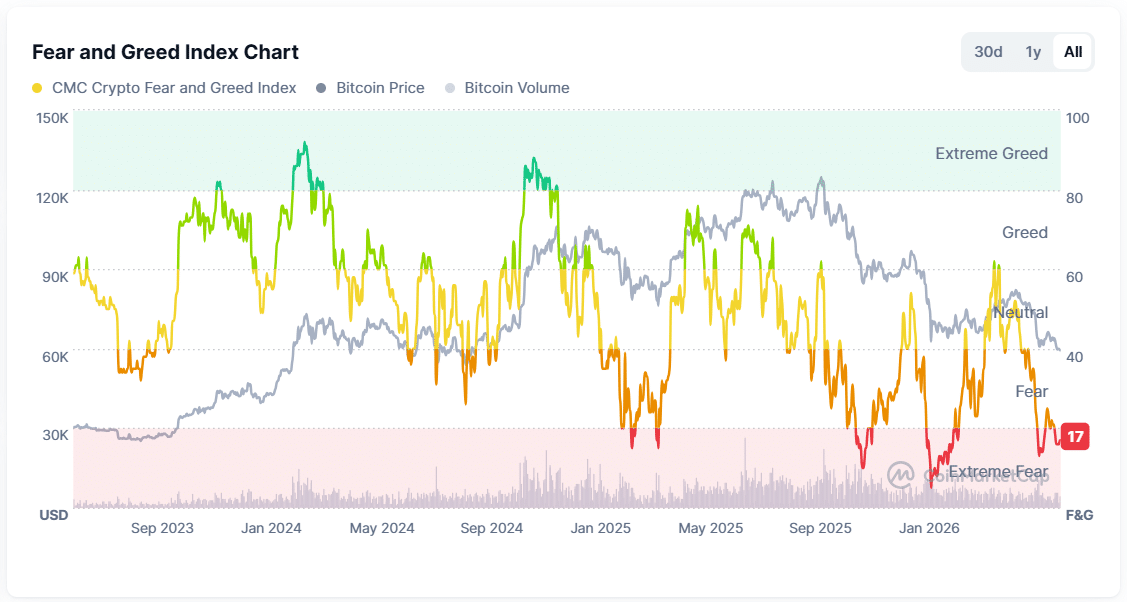
Current conditions align better with a post-capitulation consolidation or deleveraging reset phase. The Crypto Fear & Greed Index sits in Extreme Fear territory (readings at 17 as of June 30), reflecting widespread pessimism and caution. This environment often coincides with the tail end of selling pressure rather than its peak.
Market participants appear to be de-risking methodically rather than panicking en masse. Funding rates have remained modestly positive without reaching extremes, and open interest has declined—further signs of leverage being removed from the system without forcing a deeper breakdown.
While some forecasts anticipate additional downside before a durable cycle low (potentially in the $40,000–$50,000 range later in 2026), the immediate chart evidence points to stabilization after the flush.
Read: Bitcoin Bear Market Bottom Forecast: Veteran Chinese Miner Predicts $42K–$44K Low in Late 2026
Sentiment, On-Chain Signals, and What Lies Ahead
The current investor sentiment remains heavily bearish. The Extreme Fear reading captures both retail caution and institutional hesitation following ETF outflows earlier this year. Social media and trader discussions reflect debate over whether $60,000 represents strong support or merely a temporary pause before further weakness.
On-chain activity provides nuanced context. Earlier capitulation signals, such as elevated realized losses and supply moving into loss, have eased in intensity recently, consistent with the volume and liquidation cooldown. Long-term holder behavior will be critical to monitor: sustained accumulation at these levels would strengthen the bullish case, while continued distribution could pressure prices lower.
Looking forward, several factors could influence the next move. A decisive break above $61,000–$62,000 with rising volume would signal renewed buying interest and potentially target the mid-$60,000s. Conversely, a sustained break below $59,000 could retest lower supports and test the resolve of remaining holders.
Seasonal patterns offer mild optimism for bulls—historical data shows July has often delivered positive returns following red Junes—but macro conditions and institutional flows will likely dominate. Reduced leverage and cooling activity create a cleaner setup for whichever direction the next catalyst pushes.
Also read: Strategy Shares MSTR Open Higher Despite Bitcoin Sale Plan