Key Highlights
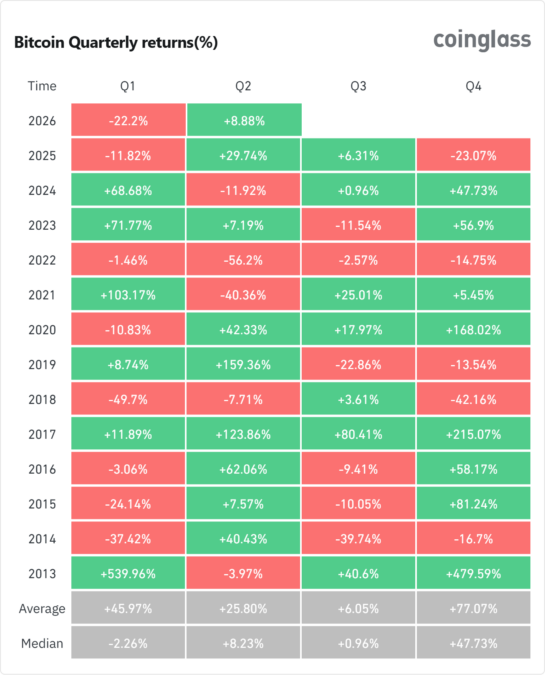
- Bitcoin posted its worst first-quarter performance since 2018, dropping 23-24% from around $87,500 at the start of 2026 to roughly $66,700–$68,200 by end-March. This marked the first back-to-back quarterly losses since 2022 after a sharp decline from its $126,000 all-time high in October 2025.
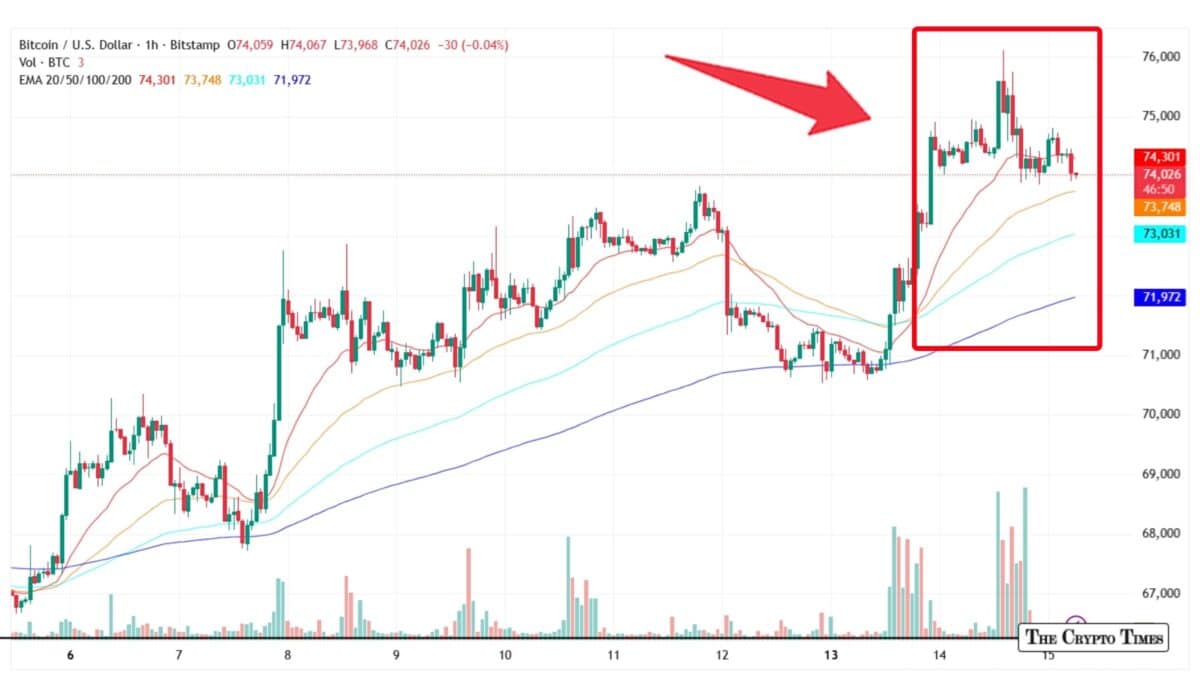
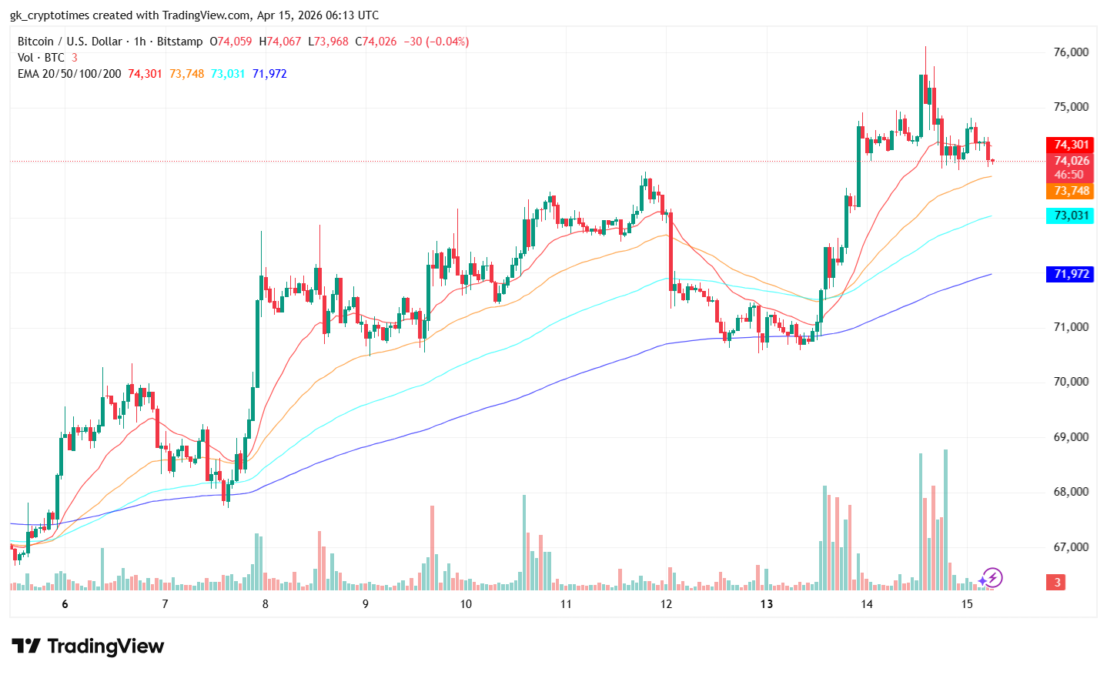
- BTC staged a tentative recovery in mid-April, surging from lows near $70,758 on April 13 to an intraday high above $76,000 on April 14, before pulling back to trade near $73,900. The move was supported by hopes of easing Middle East tensions and softer U.S. inflation data.
- Traders are focused on a tight $70,000–$76,000 range, with support at $70,000–$71,000 and resistance at $75,000–$76,000. April’s historical 69% positive return rate faces headwinds from geopolitical risks, mixed ETF flows, and macro uncertainty, keeping sentiment in “fear” territory despite some resilient institutional buying.
Bitcoin (BTC) staged a modest recovery in mid-April 2026, climbing back toward the $76,000 mark before pulling back amid ongoing market jitters.
As of Wednesday morning, the world’s largest cryptocurrency was trading near $73,900, down about 0.4% on the day after opening around $74,175. The move marked a tentative rebound from early April lows near $68,000, yet the broader picture remains cautious.
Earlier in the week, it surged from roughly $70,758 on April 13 to an intraday high above $76,000 on April 14, fueled by hopes of easing geopolitical strains in the Middle East and softer-than-expected U.S. inflation readings that briefly lifted risk assets.
Roughest start since 2018
Bitcoin has endured one of its roughest starts to a year in recent memory, shedding more than 22-24% in the first quarter of 2026 — its worst Q1 performance since 2018, when it plunged nearly 50%.
The cryptocurrency opened the year near $87,500 on January 1 and closed March around $66,700–$68,200, erasing over $20,000 from its price in three months.
This marked the third-worst first-quarter drop in Bitcoin’s history and the first back-to-back quarterly loss since 2022, following a roughly 23% decline in Q4 2025 from its all-time high above $126,000 in early October 2025.
Primary factors behind the historic Q1 performance were heavy net outflows from spot Bitcoin ETFs, delayed crypto bills, and escalating geopolitical tensions—which all contributed to the risk-off selling pressure.
While March brought some stabilization and modest ETF inflow recovery, the quarter ended on a somber note, breaking a strong run of positive or modest Q1 returns in most recent years.
Traders are now watching a narrow trading range between roughly $70,000 and $76,000. Support sits near $70,000–$71,000, with deeper floors around $67,000 and $60,000 should selling intensify.
While overhead resistance looms at $75,000–$76,000, a clean break above that level could open the door to $80,000, analysts say, while a drop below $70,000 might test lower supports quickly.
April’s mixed outlook
April has historically been kind to Bitcoin, delivering positive returns about 69% of the time. This year, however, seasonal tailwinds are clashing with persistent headwinds: elevated geopolitical risks, mixed signals from institutional Bitcoin ETF flows, and lingering macroeconomic uncertainty.
Market sentiment hovers in “fear” territory, though some participants point to resilient institutional buying during the downturn as a potential foundation for recovery. Spot ETF data showed net outflows early in the quarter before a partial rebound in March.
Bitcoin’s 24/7 nature means prices can shift fast on any headline. Investors are eyeing upcoming inflation data, regulatory developments, and any de-escalation in global tensions for the next directional cue.
Also read: Goldman Sachs Files With SEC For Bitcoin Premium Income ETF