Key Highlights
- Bitcoin hovers around $67,800 amid escalating Middle East tensions that have driven oil prices near $100 and pushed the VIX above 30, reinforcing its behavior as a risk-on asset rather than a safe haven during periods of global uncertainty.
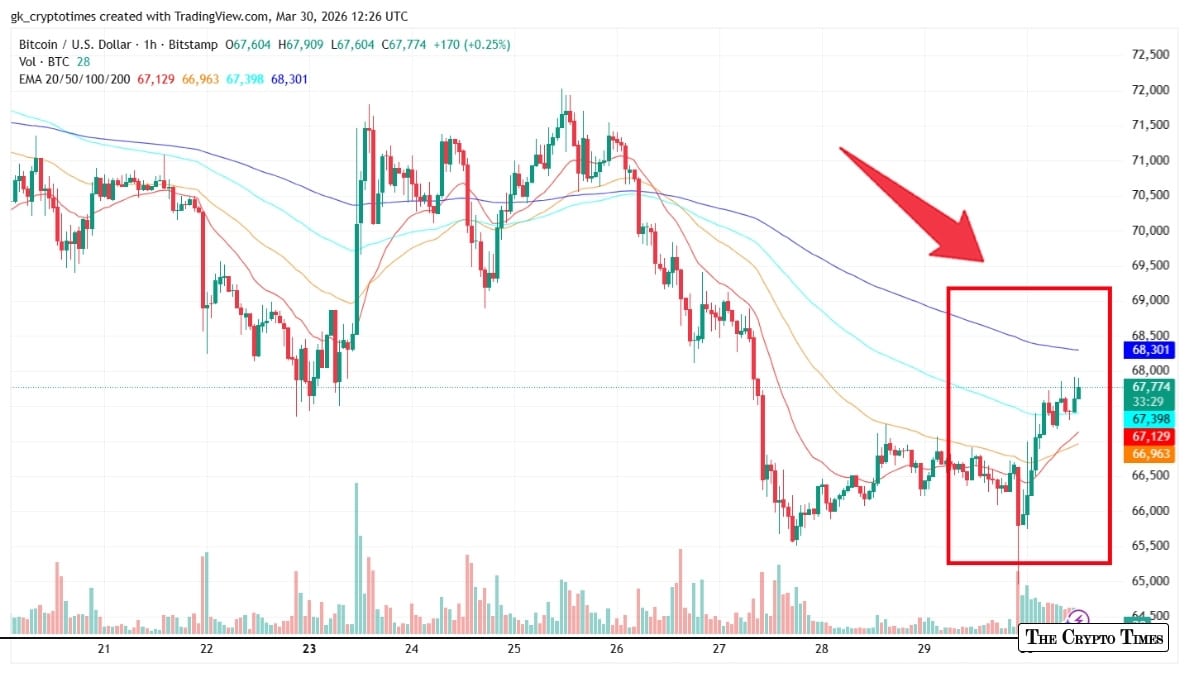
- The 1-hour chart shows a clear short-term downtrend with lower highs and lower lows, as Bitcoin trades just above its EMA 20 while facing stacked resistance from the EMA 50, 100, and 200. A decisive break above $68,300 would be needed for any near-term reversal.
- Despite the pullback, CryptoQuant analysis highlights Bitcoin entering a historical accumulation zone near its realized price, with no full capitulation yet. Long-term holders continue quiet accumulation, suggesting the dip could offer asymmetric upside for patient buyers once selling pressure exhausts.
Bitcoin’s recent slide has traders on edge, with the cryptocurrency struggling to surge past key resistance levels amid a broader risk-off mood sweeping global markets.
Geopolitical tensions in the Middle East, particularly escalating conflicts involving Israel and Iran, have pushed oil prices close to $100 per barrel and sent the VIX fear gauge spiking above 30. This classic risk-off environment has weighed on Bitcoin, which has at times behaved more like a growth asset than a safe haven.
As of publishing (30 March 2026, 12:25 PM UTC), Bitcoin trades around $67,800 after pulling back from peaks near $71,000 earlier in the month.

Bitcoin’s recent price action reveals a clear downtrend over the past week, characterized by a series of lower highs and lower lows, with a sharp sell-off around March 27–28 that took BTC briefly toward the mid-$65,000 area before a tentative bounce.
The four exponential moving averages tell a bearish story in the short term: the fastest EMA 20 sits at $67,129, with price currently trading just above it, while the EMA 50 ($66,963), EMA 100 ($67,398), and EMA 200 ($68,301) are stacked in descending order above the current price.
This alignment confirms downward momentum, with the longer EMAs acting as dynamic resistance overhead. A sustained move above the EMA 200 near $68,300 would be needed to signal any meaningful short-term trend reversal.
Onchain signals hints for persistent buy-zone
The current on-chain data suggests the dip may represent something more constructive: an entry point into a historical accumulation zone.
“As Bitcoin’s spot price falls lower, it’s reaching toward the realized price that has historically been an indicator for undervaluation,” said one on-chain researcher on CryptoQuant’s QuickTake analysis. “During early 2020 and late 2022, Bitcoin’s spot price plunged under the realized price, mirroring a buying opportunity.”
“It’s easy to see the pattern repeating in 2026: While quant models indicate Bitcoin’s consolidation, a true bottom indicator would be spot dipping deep into the realized price territory, again,” the analyst notes.
The absence of extreme pain is telling. Metrics like the MVRV ratio hover around 1.25, indicating the average holder sits modestly in profit rather than deep underwater. Realized losses have ticked up during the recent correction but remain far below the levels that defined prior bear market lows. Miners, meanwhile, continue to hold with healthy margins, adding structural support.

“Like in the bear cycle of 2022, Bitcoin is again in the accumulation zone, representing historically undervalued spot prices,” the analyst further emphasized, “The smart money accumulates here.”
Softening institutional demand in the U.S.
Amid the broader market drawdown, the Coinbase Premium has turned negative, pointing to softening U.S. institutional demand. Moreover, rising whale deposits on Binance suggest some large holders may be preparing to distribute.
These dynamics, combined with lingering macro headwinds from elevated oil prices and tighter credit conditions, could pressure Bitcoin toward the $63,000 support zone tied to the cost basis of 1.5–2-year holders in the near term.
Still, the broader structure favors patient buyers. Long-term holder accumulation has quietly accelerated beneath the surface volatility, a pattern that historically preceded stronger rallies once selling pressure exhausts.
Looking ahead, Bitcoin’s trajectory hinges on two fronts, according to the analyst. A de-escalation in Middle East tensions could ease oil-driven inflation fears and restore risk appetite, potentially lifting BTC back toward $75,000 or higher. Persistent conflict, however, risks further volatility and a deeper test of support levels. Without a full capitulation event, analysts expect choppy, range-bound action through the second quarter before any decisive breakout.
For now, the market sits in a delicate balance: macro uncertainty capping upside, while on-chain resilience prevents a collapse. Investors scanning for the next leg higher may find the current consolidation less a warning sign and more a reminder of Bitcoin’s cyclical nature—where pain for the impatient often becomes opportunity for the prepared.
Also read: Spot Crypto ETFs Reverse: $414M Outflows Hit BTC and ETH, XRP Gains