Key Highlights
- Solana (SOL) rose from $135 to $144, and is now trading around $139, showing a quick recovery above key support.
- $145 is the main resistance; breaking it could open the way to $165–$180 and eventually $200.
- Trading volume surged 223% to $5.57 billion, but new wallet creation has dropped.
Solana (SOL) is back in the spotlight, with its chart displaying a potential bullish trend reversal after months of pushing downwards.
At the time of writing, the token is trading at $140.70. It has been able to climb back above the $140 level in less than a week after briefly falling below $135. This recovery has pushed the price into a price zone near $145, which has stopped the price from rising several times since November 2025.

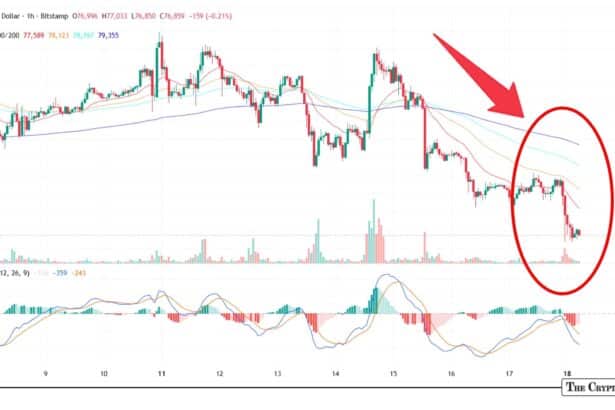
Earlier attempts to break past this zone ended with a sharp fall of around 15% to 20%, down to $117. This time, however, the price behavior looks different. Instead of a sharp fall, Solana only dropped by around 3% to 4% before buyers stepped in again.
This small drop suggests that selling pressure might be weakening and buying might soon take over the market. During early trading hours today, the price touched close to $144 and is now moving sideways.
Rounded bottom forms on daily timeframe
On the technical side, the chart has formed a rounded bottom pattern, which is often in a bullish pattern. This pattern formed in early December, when the price fell with momentum due to the current price action.
This pattern has also been validated with a cup and handle pattern on the four-hour timeframe, suggesting a clearer confirmation for a potential rally.
At the same time, SOL is trading above its 20-day, 50-day, and 100-day averages. This kind of setup was last seen in September 2025 and usually suggests that the price is in a stronger position.
On the lower timeframe, Solana is testing a resistance range between $141.5 and $145.4. This area lines up with the neckline of a double-bottom pattern, which is a common chart shape that can lead to further gains if the price breaks above it. In addition to that, the Relative Strength Index (RSI) is currently at 64, while the moving average is at 56. This suggests that the buyers are controlling the price.

Can SOL reclaim $200?
For SOL to surge up to the $200 price mark, a boost from the potential breakout is required. With a break above the $145 resistance, the market might potentially retrace a little bit to correct the imbalance in the market before starting another rally, which could surge up to $200.
In short, a strong daily close above this $145 level would help confirm that buyers are in control and that the move is not just a short-term spike.
However, after clearing $145, the next areas to watch would be between $165 and $180, where selling pressure has appeared in the past. These levels could slow down the price and cause short pauses as traders take profits. If SOL can move through this zone with steady volume, it would increase the chances of a continued move toward the $200 level.
Also Read: Optimism Proposes 50% Superchain Revenue for OP Token Buybacks
Disclaimer:
The Crypto Times publishes news, analysis, and educational content for informational purposes only. We do not offer financial, investment, legal, or trading advice of any kind. All content on our website is intended to be neutral and fact-based. Readers should always do their own research, consult with licensed professionals, and evaluate risks independently.
The Crypto Times does not endorse or recommend any specific cryptocurrencies, tokens, projects, financial products, or investment strategies. We do not accept legal liability for any financial losses incurred as a result of reliance on information published by us.