The price of Tron (TRX) has been able to remain above $0.20, trading at around $0.22 currently. Sustaining its upward trend may be challenging with strong resistance levels and deteriorating market sentiment.
One of the key indicators signaling a potential pullback is the In/Out of Money Around Price (IOMAP). This metric identifies price ranges where many tokens were bought at a loss or profit, indicating areas of strong support or resistance.
When TRX was at $0.23, around 3.34 million addresses owned 3.33 billion TRX in loss, and when it was at $0.24, around 4.72 million addresses owned 3.92 billion TRX in loss.
These levels are resistant since most of the holders may decide to sell their TRX at breakeven to stop the price going any higher. If TRX tries to cross $0.23 or $0.24, it could fail due to pressure of sale from these holders.
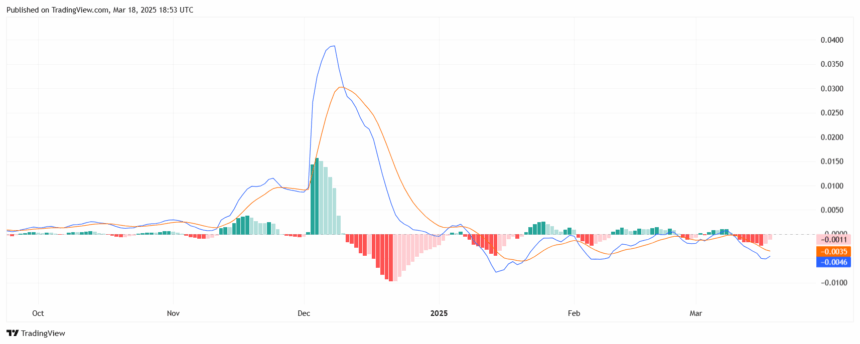
Technical indicators also suggest that TRX might not be able to sustain an uptrend. The Moving Average Convergence Divergence (MACD), which tracks momentum, has dropped into negative territory.
A bearish crossover happened with the 12-day EMA (blue) dropping below the 26-day EMA (orange), a sign that the bullish trend is fading. The price of TRX may still be below $0.24 in the near term if the trend persists.
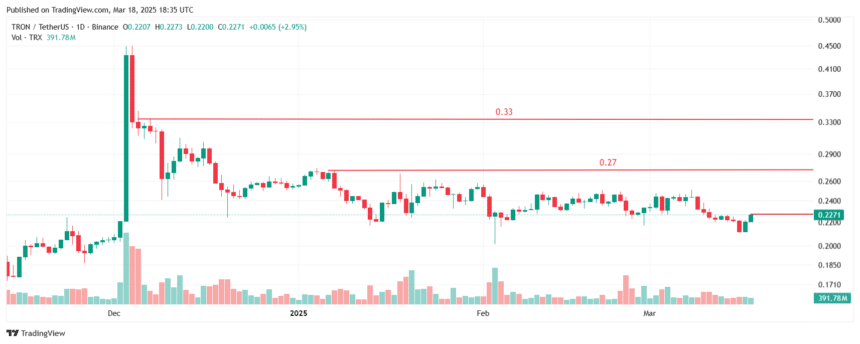
The Fibonacci retracement tool indicates that TRX is trading close to the 0.236 Fib level, a key support area. If TRX manages to break past $0.22, it may rise to $0.27 (0.382 Fib level), and with even more momentum, it might even hit $0.33.
However, if the selling pressure mounts, the price may fall to $0.15. Considering the uncertainty in the current market, the traders should keep a keen eye on key resistance areas before expecting a major upsurge.
Also Read: TRON Leads Blockchain Revenue, Outpacing Ethereum and Bitcoin