Key Highlights
- Bitcoin traders’ unrealized profit margins have hit their highest level since June 2025.
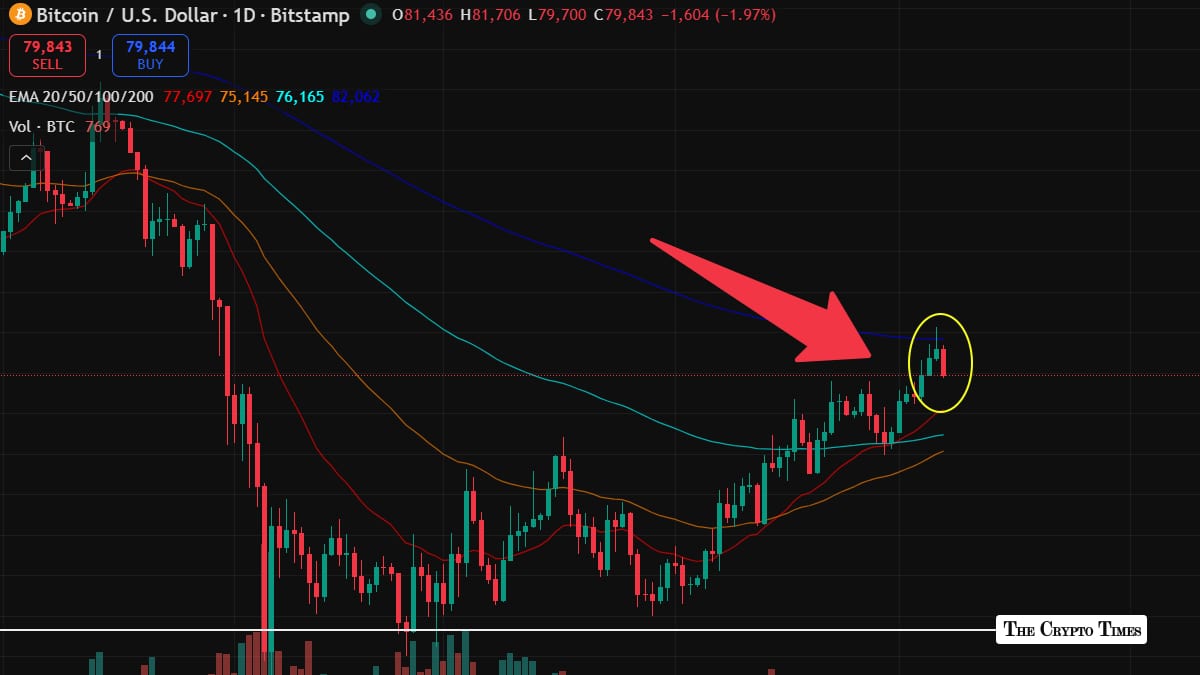
- BTC pulled back near $79,836 after reaching an intraday high of $81,729.
- The daily chart still shows BTC above key moving averages, but profit-taking risk is rising.
Bitcoin traders are sitting on their highest unrealized profit margins since June 2025, raising the risk of short-term profit-taking as BTC slips back below the $80,000 level.
Bitcoin was recently trading near $79,836, down 2.21% on the day, after touching an intraday high of $81,729 and a low of $79,728. The move shows BTC cooling after a strong recovery that pushed the price above several key moving averages on the daily chart.
CryptoQuant’s on-chain trader realized price and profit/loss margin chart shows that Bitcoin held between one and three months is now carrying its highest unrealized profit margin since June 2025. That means a major short-term holder cohort is sitting on meaningful paper gains.
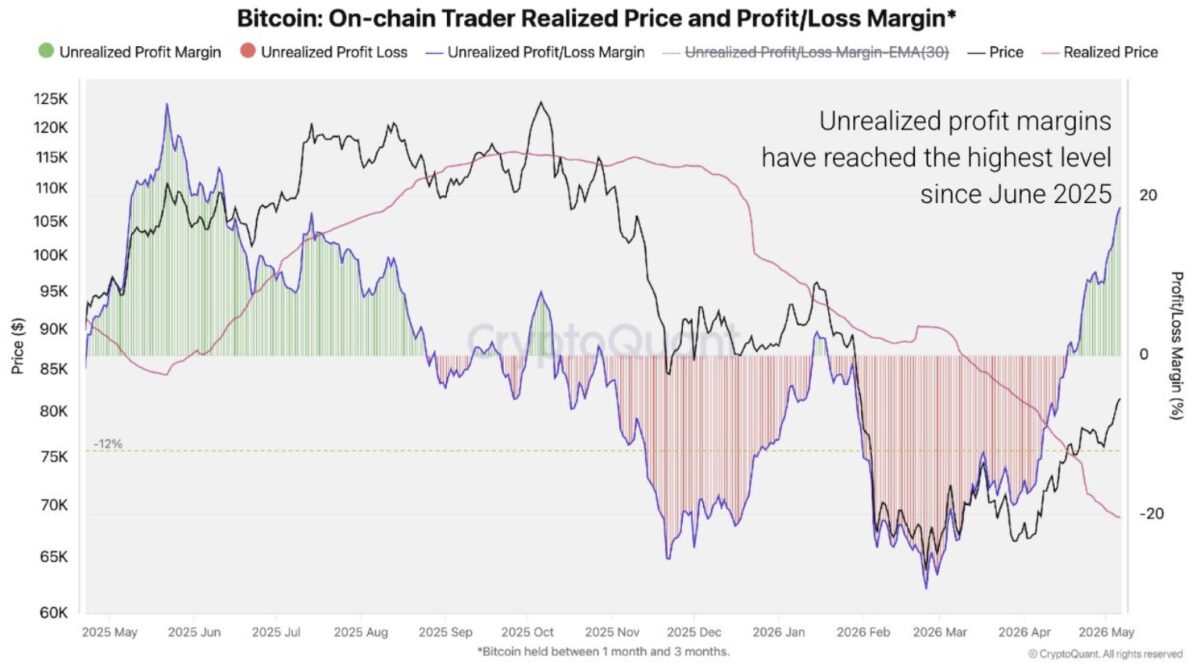
Historically, these conditions increase correction risk, as traders become more incentivized to lock in gains when BTC rallies sharply above their cost basis.
BTC holds bullish structure, but rejection risk builds
The Binance BTC/USDT daily chart shows Bitcoin still trading above the key moving-average zone near $73,244 and $71,892, keeping the broader recovery structure intact.
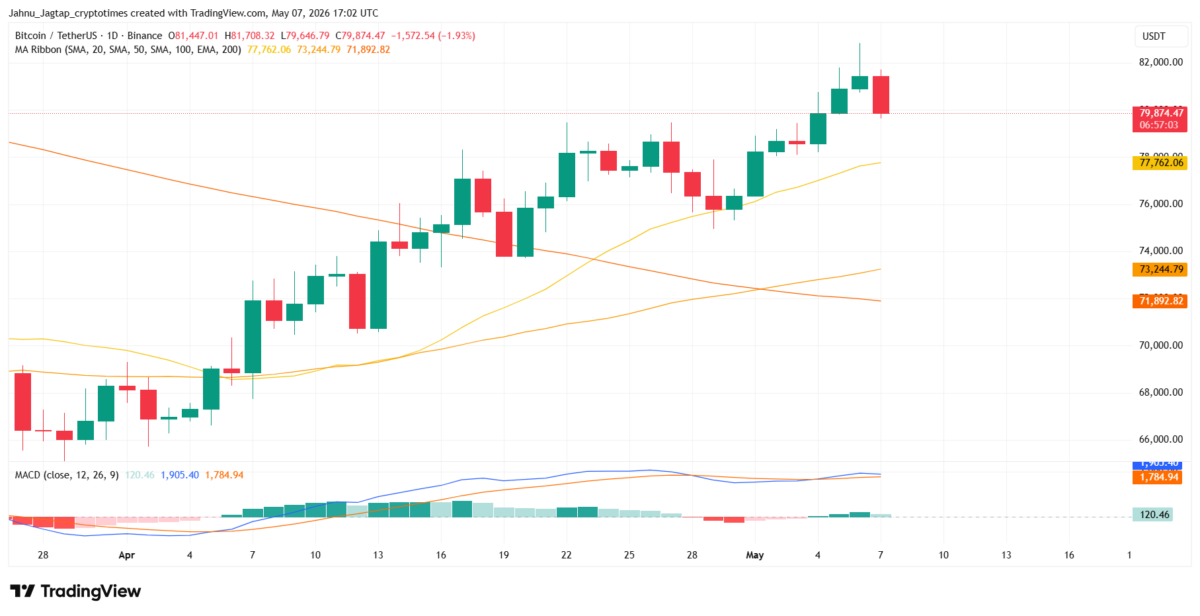
However, the latest candle shows BTC pulling back after testing the $81,000–$82,000 region. That area now becomes the immediate resistance zone for bulls to reclaim.
The MACD remains positive, with the signal lines still holding above the zero region, suggesting momentum has not fully broken yet. But the latest red candle shows that traders are already reacting to higher levels, consistent with the profit-taking warning from the on-chain data.
Key Levels to Watch
For Bitcoin bulls, the first test is whether BTC can reclaim and hold above $80,000. A clean move back above $81,700–$82,000 would keep upside momentum alive.
On the downside, the first support zone sits near $76,000, followed by the moving-average cluster around $73,200–$71,900. A deeper pullback toward the earlier breakout region near $70,000 would put the current rally under stronger pressure.
Market Outlook
Bitcoin’s trend has not turned bearish yet, but the market has moved into a more fragile zone. BTC is still trading above key trend support, while on-chain trader profits have reached levels last seen before earlier correction phases.
For now, the setup points to a profit-taking test rather than a confirmed breakdown. If fresh demand absorbs selling near $80,000, BTC could attempt another move toward $82,000. But if traders begin locking in gains aggressively, Bitcoin may revisit the $76,000–$73,000 support range before its next major directional move.
Also Read: Today in Crypto: Tokenization Breakthrough, Clarity Act Deadline Set, Miners Pivot to AI Power Plays