
Key Highlights
- The move comes amid fresh optimism in regard to geopolitical stability and trade corridors.
- There is a significant rise in trading volumes amid growing short-term interest.
- A market recovery phase is seen amid previous weekly volatility.
Bitcoin (BTC) rallied past $78k today, reaching as much as $78,666 during intraday trade following news about the recent attempt by Iran to reach a peaceful resolution to their conflict with the US.
As per the CoinMarketCap data, the performance of the crypto asset saw an appreciation of about 2.78% during the last 24 hours with a 1.11% weekly gain in another. The market capitalization of Bitcoin stands at $1.57 trillion, showing a 2.78% uptick. The 24-hour trading volume reached $36.6 billion, and circulating supply remained at 20.02 million out of a maximum supply cap of 21 million.
The catalyst for today’s surge is attributed to de-escalation hopes following Iran’s proposal to conclude the conflict with the U.S., including the potential reopening of the Strait of Hormuz. The movement in crypto assets has been observed to be influenced by Iran-US tensions.
Previously, the price of Bitcoin surged following the opening of Strait of Hormuz news on April 17 but quickly dipped a day after following the closure news.
BTC price movement
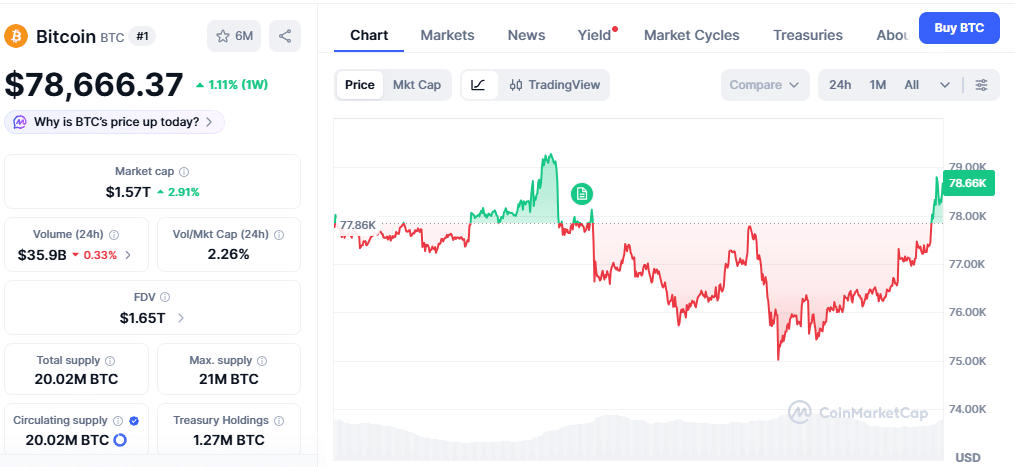
The daily chart (24-hour timeframe) shows a powerful bullish candle where BTC broke through its previous consolidation zone in the area of $77,000. Previously, there was a temporary fall in intraday trading to a low of $76,085, but then there was a recovery that sent BTC towards the $78,000 region.
On the green line chart, there were numerous higher lows during the day, resulting in a rapid rise in the afternoon hours to reach a peak near $78,894. On the weekly chart, more volatility is observed. BTC bounced back from a deep retracement to reach lows in the area of $75,000 previously in the week. There is a green candlestick spike sending BTC towards $79,000, followed by red corrective candles reaching the level of $75,000 and a current recovery wave.
This indicates that buyers are protecting key support areas formed after the major correction in BTC above $125,000 at the end of 2025. Currently, BTC is in a recovery phase amid an ongoing bear market rally.
The technical analysis
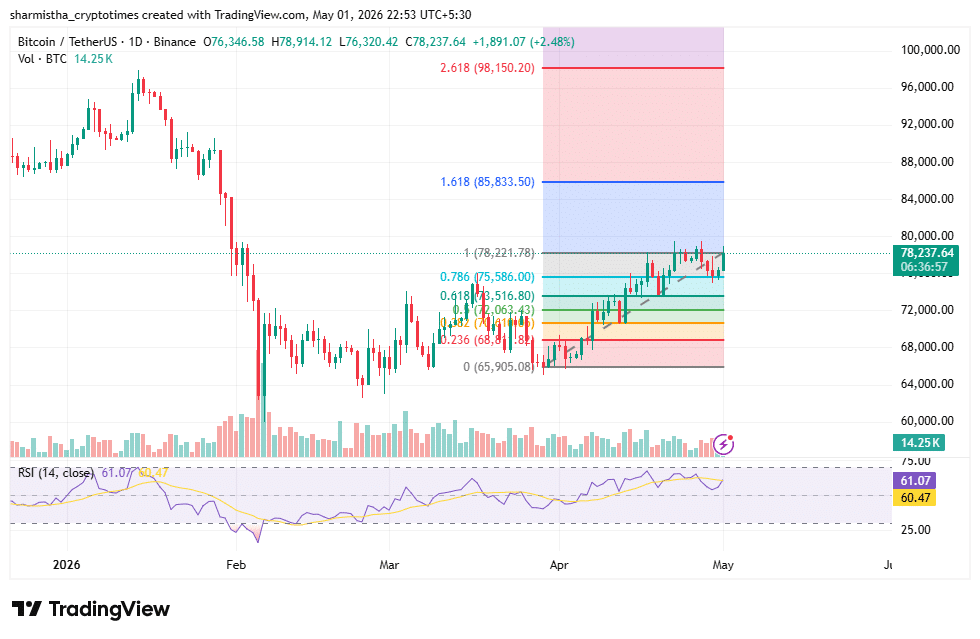
The technical analysis suggests the relative strength index (RSI 14) is standing at 61, sitting squarely in the neutral area and avoiding overbought conditions. This further leaves the room for additional upside without immediate exhaustion signals.
The wider summary meter points toward a buy situation on the 1-week view, aligning broadly with today’s price surge.
At the Fibonacci scale (7-day), the immediate resistance appears around the $117,204 level. A decisive break over 97,402 could open the path for further gains. On the downside, the support lies at $77,600. The overall market structure indicates a rebound from February 2026 lows.
Broader context
Although the short-term technical configuration is bullish, with several short-term moving averages pointing towards a buy and the neutral RSI indicating upside space, long-term metrics point towards continued overhead resistance.
Consistent strength above $78,000 will be critical for bulls to take on higher levels of resistance. Traders will be keenly observing volume, the impact of the Iran-US talks, and economic data for validation. The robustness of Bitcoin around the $78,500 level in light of these developments signifies its growing maturity as an international risk asset. Whether this rally signals the start of a stronger recovery or will be rejected around psychological levels is yet to be determined.
Also Read: Brazil Bans Virtual Assets in eFX Cross-Border Payments Settlement