Key Highlights
- XRP has plummeted to $1.75, decisively breaching the $1.78 swing low and the $110 billion market cap floor.
- The token’s failure to hold the $2.02 and $2.09 levels has flipped these former supports into heavy resistance zones.
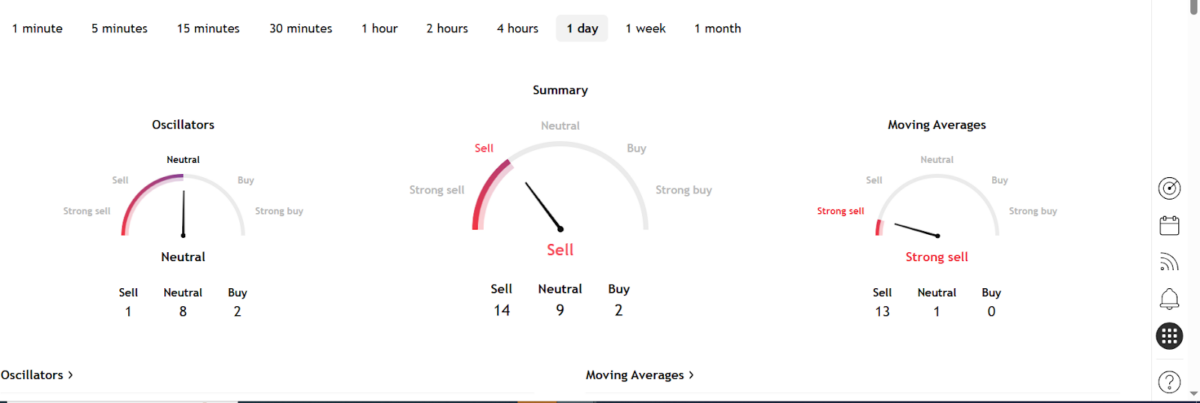
- Technical indicators show weakness as the token trades below its 30-day and 200-day moving averages with a “Strong Sell” signal.
Institutional whales and retail investors experienced a market downturn today as XRP’s market cap dropped below $110 billion. The token fell from $1.91 to $1.75 in recent trading sessions amid huge liquidation that wiped out $62 million, with the majority of longs getting wiped out.
At the time of writing, XRP is trading at $1.76, reflecting a decline of 2.26% over 24 hours. Its total market capitalization stands at $107.5 billion. As the price drops instigate panic selling from weak hands, the 24-hour trading volume has increased by over 45%.
CoinGlass data shows that XRP experienced a major long squeeze, with over $62.2 million in total liquidations over 24 hours. The long positions accounted for about 98%, i.e., $60.99 million of the total wipeout.
There has been a 4.26x liquidation in the 7-day average. The largest single liquidation was about $17.38 million, suggesting a sharp price pullback. The liquidation heat was primarily concentrated on Hyperliquid, which handled over $44 million, roughly 70%, of the total volume, followed by Bybit and Binance.
Technical breakdown
The price drop was further fueled by a “long squeeze,” where the forced selling of the asset due to liquidated positions caused the price to drop faster than it would have otherwise. The token also experienced a technical breakdown, where XRP dropped below its 30-day Simple Moving Average of $2.02 and the 50% Fibonacci retracement level of $2.09. These levels, which were previously a source of support, have now become a strong source of resistance.
Market data from the last quarter shows that XRP had been trying to stabilize above the $2.00 mark as part of its function as a utility bridge for financial institutions. However, the current decline of 6.59% is much worse than the overall crypto market’s 5.54% drop.
Unlike speculative meme coins, XRP’s value is often linked to institutional risk demand. Its faster decline suggests that large holders are reducing their risk by moving into stablecoins or other major coins, seeking safety as the Altcoin Season Index fell by 12.5%.
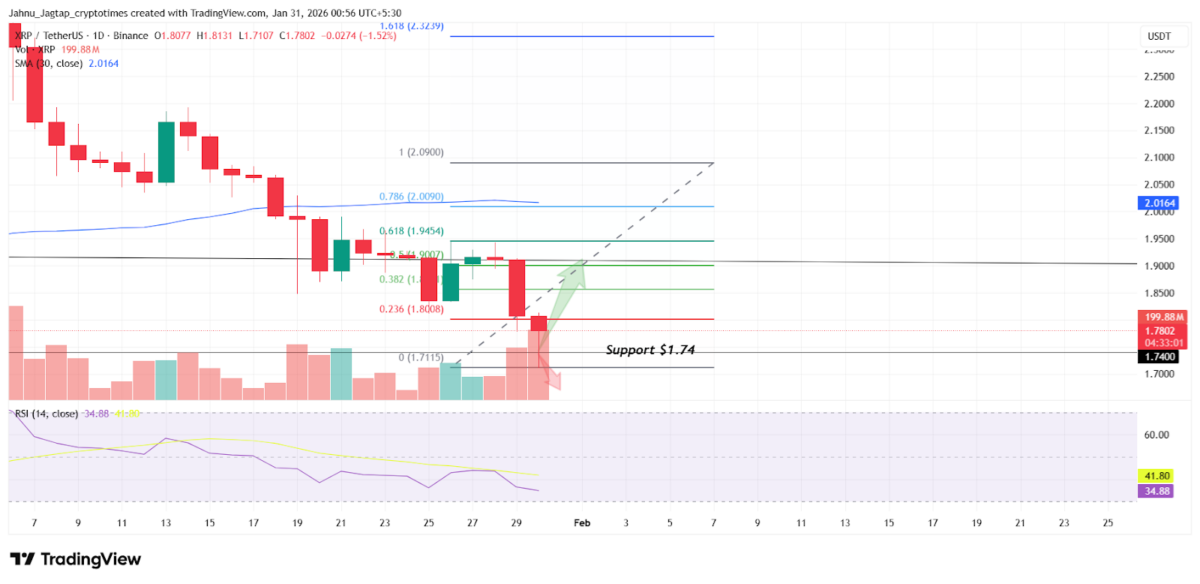
The Relative Strength Index (RSI) has dropped to 28.29. The lack of huge buying volume shows that market participants are hesitant. Most traders seem to be waiting on the sidelines, looking to see if a deeper bottom forms before investing again.
Bearish signals and RSI levels
TradingView technical gauges have issued a “Sell” signal, backed by a 14-to-0 ratio of bearish to bullish moving averages.
The future implications of this decline focus on the $1.78 swing low and the $110 billion market cap floor. If the total ecosystem valuation falls below this critical point, the liquidation of assets may continue unless buyers purchase the $1.75 level. If XRP is an indicator of institutional fear, then the failure to move above the $2.02 level may signal a long-term downturn for high-utility altcoins.
Also Read: Ethereum Plunges Below $2,700 — Could $2,094 Be Next?