Bitcoin is once again knocking on a door that has slammed shut three times before. As of May 12, 2026, the cryptocurrency is trading in the $80,000 to $82,000 range, hovering perilously close to the short-term holder (STH) realized price—the average cost at which investors who bought within the past 155 days acquired their coins.
A fresh CryptoQuant analysis frames the moment as a potential fourth rejection or the spark for a genuine breakout, a tension that on-chain data suggests could decide whether the market consolidates further or launches into the next leg higher.
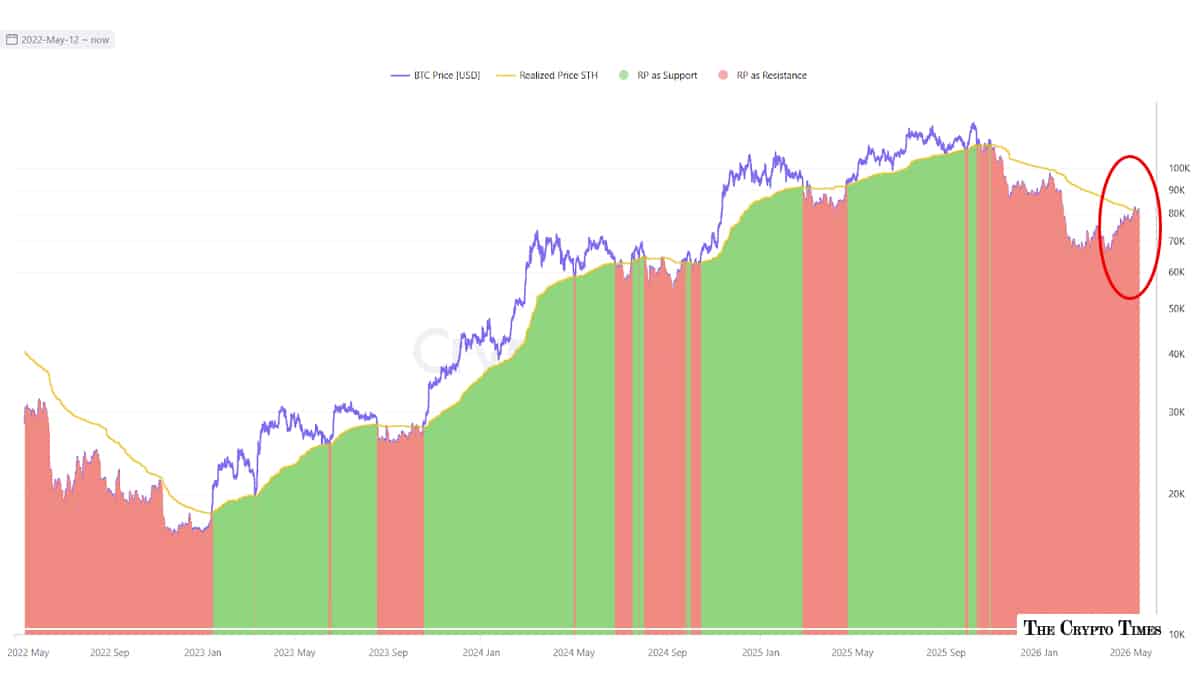
The STH realized price, currently sitting near $81,000, has emerged as one of the most watched levels in the 2025-2026 bull cycle. When Bitcoin trades below it, recent buyers sit at a loss, creating a wall of potential selling pressure as they wait to break even.
Cross above it convincingly, and those same holders flip into profit, easing supply and often fueling rallies.
The repeated tests have turned this metric into a behavioral battleground rather than just a number.
The Anatomy of the Fourth Test
Market participants have seen this script before. In late 2025, Bitcoin dipped below the STH cost basis around $104,000 and lingered there for weeks, pressuring newer entrants.
By April 2026, the level had shifted higher to roughly $91,500 before another rejection sent prices sliding. A third test came in early May near $81,500, where sellers stepped in aggressively enough to keep the price capped.
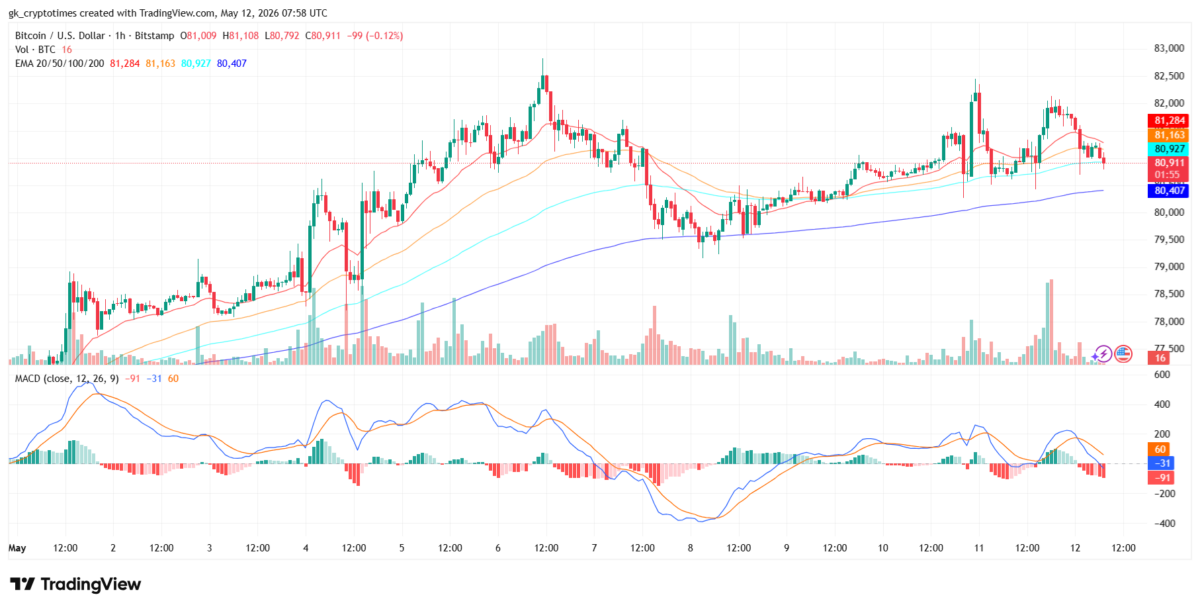
Now, with Bitcoin stabilizing just above $81,000 after a volatile weekend that saw it spike to $82,430 before pulling back, the fourth encounter feels different in one key way: the gap between spot price and STH cost basis has narrowed sharply.
On May 7, the realized price for short-term holders stood at about $78,992, according to on-chain trackers, putting current levels within striking distance. Exchange inflows tell part of the story—97% of coins hitting platforms in recent sessions originated from STH wallets, yet the volume of those inflows has collapsed from a spike of over 35,000 BTC in late April to under 4,000 BTC by early May. That compression suggests sellers are running out of steam.
Traders watching the charts note that daily closes matter most here. A clean push and hold above $81,500 would flip the level from resistance to support, potentially clearing the path toward $87,000–$92,000. Fail to do so, and the market risks another retest of lower supports, possibly the longer-term holder realized price near $48,000, though most analysts see that as a distant worst-case scenario given broader market resilience.
Patterns from Earlier Rejections
History in this cycle offers a cautionary map. Each prior rejection at the STH line coincided with heightened selling from newer investors chasing momentum. In December 2025, when Bitcoin first slipped below the $104,000 mark, short-term holders faced average losses that triggered a wave of capitulation.
The same dynamic played out in April, when a rebound from lower levels met the $91,500 barrier and reversed, leading to a 34 percent correction in some segments of the market.
What stands out this time is the behavior of long-term holders (LTH), those who have held for more than 155 days. Their realized price remains far lower, around $48,000, and they continue to show little distress.
The LTH-to-STH SOPR ratio—a measure of relative profitability—bottomed near 0.99 in late April before climbing to 1.097, indicating that seasoned investors are spending profitably while recent buyers scrape by at a modest 2 percent average loss.
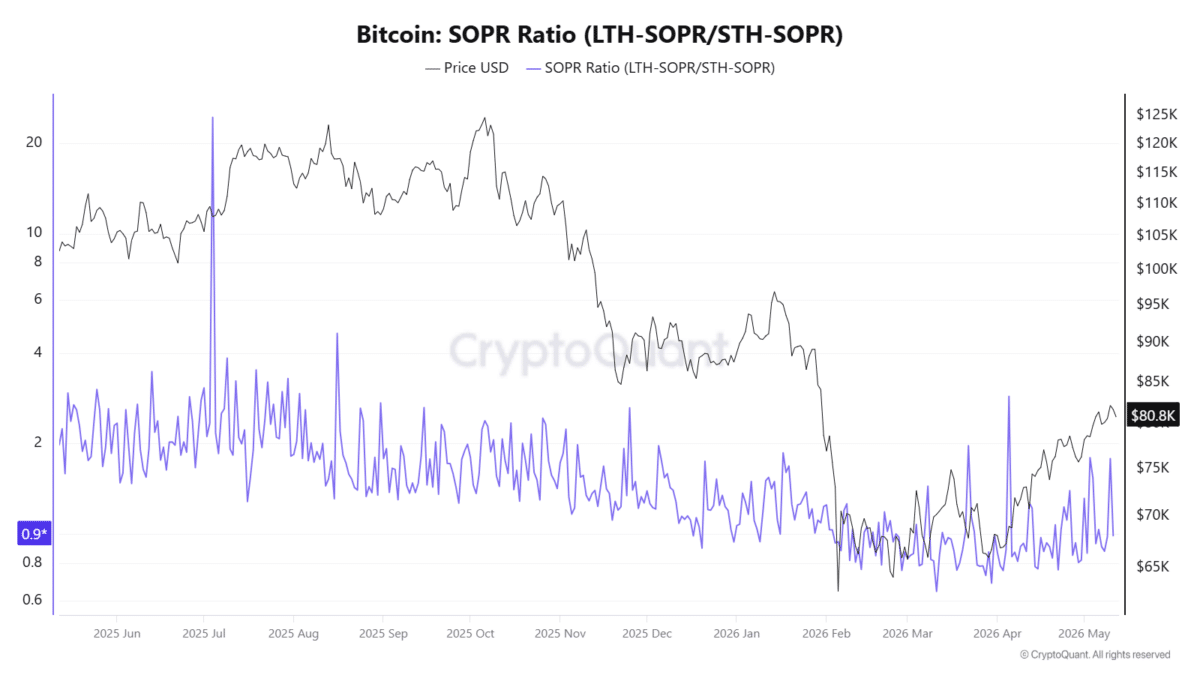
This divergence has historically preceded turning points, as long-term capital absorbs supply and newer money regains confidence.
Sentiment indicators have also shifted. Market mood flipped to “optimism/recovery” for the first time in weeks, coinciding with spot Bitcoin ETFs logging nearly $59 billion in cumulative inflows since their launch. Open interest in futures hit yearly highs even as leverage was flushed out during the weekend pullback. These factors suggest the crowd is not panicking but positioning for resolution.
Implications for the Road Ahead
A successful breakout would carry more than symbolic weight. It would signal that the market has absorbed the latest round of short-term selling, reducing overhead supply and inviting fresh capital.
Technical analysis points to bullish setups such as a MACD crossover on daily charts, while on-chain metrics show STH profitability improving day by day. Should Bitcoin close the week above the $81,500 threshold, the path to $87,000 becomes a realistic near-term target, with some observers eyeing $92,000 as the next psychological hurdle.
Conversely, a fourth rejection would reinforce the pattern of resistance and could invite a deeper consolidation phase. Prices might drift back toward $75,000–$78,000, testing the patience of retail participants and potentially shaking out weaker hands.
Yet even in that scenario, the overall structure remains constructive: Bitcoin has climbed from under $8,000 in 2011 to these levels through repeated cycles of doubt and conviction, and long-term holders continue to provide a solid floor.
For investors, the takeaway is clear. The STH cost basis is not just another line on a chart—it reflects real human behavior, the point where fear and greed among recent buyers collide. Whether this fourth test ends in rejection or breakout, it will likely set the tone for the coming weeks.
Traders are watching exchange flows, SOPR readings, and daily closes with heightened focus. In a market defined by volatility, this particular level has become the pivot on which the next chapter turns. The next few trading sessions could prove decisive.
Also read: MARA Reports $1.2B Q1 Loss, Dumps 15,100 BTC & Doubles Down on AI