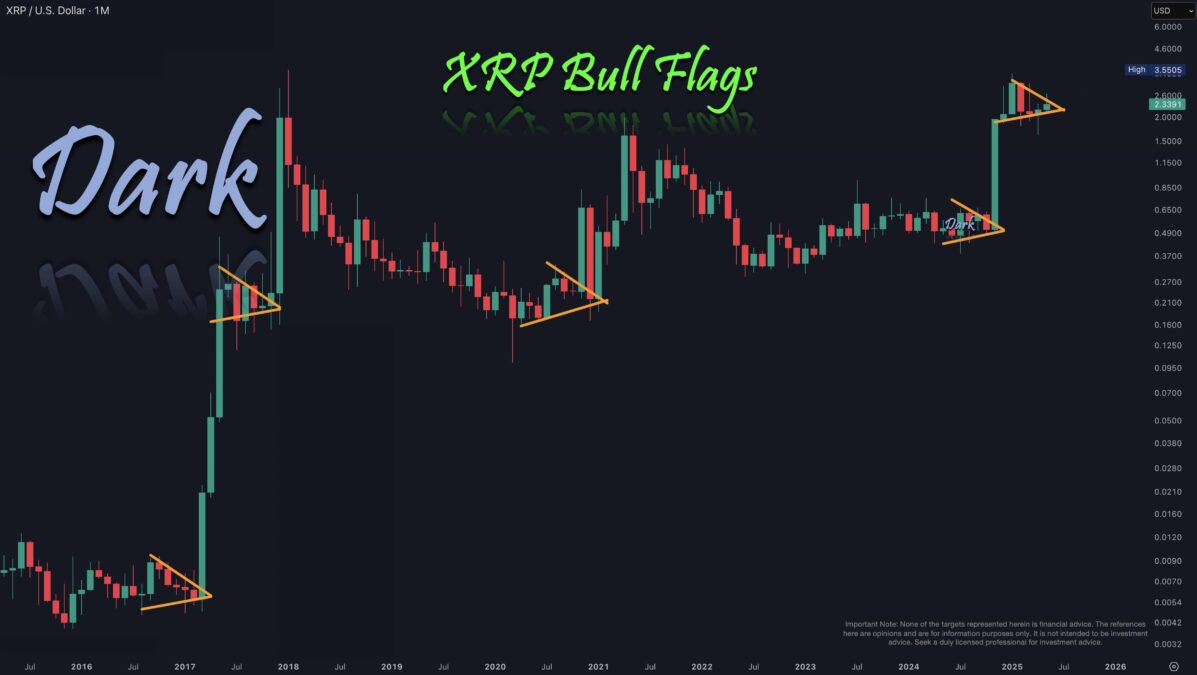
Famed classical chartist Peter Brandt has recently posted a series of tweets setting the crypto community abuzz. Brant predicts that the future trend for XRP is “UP UP UP.” Initially referring to it as a mystery market, he posted a chart displaying a massive multi year symmetric pattern.
“Everything I’ve learned about charts tells me the next trend in this enigmatic market will be Up Up Up. Market is just pausing in the yellow box.”
Brandt’s analysis points to a breakout from a technical pattern that has been forming since 2018. When a user questioned which chart he was referring to, he replied that it was the chart for XRPUSD, and that price was in a tight range on both the weekly and monthly charts.
This tweet followed weeks of investors waiting to see if XRP was setting up a head and shoulders top, which tends to result in a decline. Brandt indicated that if XRP fell below $1.87, it could be a weakness.
But that never materialized. Instead, the price remained in a tight range, above critical support.
The Yellow Box Pattern
Currently, XRP is ranging between roughly $2.00 and $3.20. Brandt calls this range the “yellow box,” which coincides with the technical configuration called a high-tight flag. This formation tends to appear after a large price run and indicates that the market is catching its breath before making its next move.
This is consolidation, not weakness. It’s a period in which the buyers and sellers are balancing and the price doesn’t go higher or lower but sideways. The technicals validate this stop the average true range (ATR) at 0.4860, showing reduced volatility, and the ADX, an indicator of trend strength, is at 16.41. All are typical signs that the market is getting ready to break out.
Is History Repeating?
Yes. XRP has seen similar patterns occur in the past. Analysts have pointed out that XRP has formed bull flag patterns several times since 2015, with each newer one being preceded by a strong rally.
This chart also resembles Bitcoin’s pre-breakout phase in 2020 and the bullish setup in MicroStrategy (MSTR) stock prior to its huge gains.
High-tight flag patterns are proven to be effective, with a 70–85% historical success rate, as indicated by studies conducted by FXOpen and InvestinGoal.
Brandt’s analysis is centered on the question of if XRP is going to break out of this consolidation area. If it rallies above the top of the yellow box, it might trigger yet another big rally. The price is holding for the moment.
Also Read: XRP Price Forms Bullish Angle; How High Will XRP Rise?