Key Highlights
- Bitcoin currently trades at around $71,000, well below its 350-day moving average of $98,437, indicating the market is still in a healthy consolidation phase rather than showing signs of exhaustion.
- The Golden Ratio Multiplier reveals Bitcoin has not yet tested even the first major resistance at $121,700 (1.236x), with the key 1.6x golden ratio level sitting near $157,500 and the 2x band at roughly $197,000.
- Following the pattern of declining multiples, analysts expect the current bull cycle to peak between $158,000 and $197,000 — a far more moderate top compared to previous cycles, suggesting the market is maturing with room left to run.
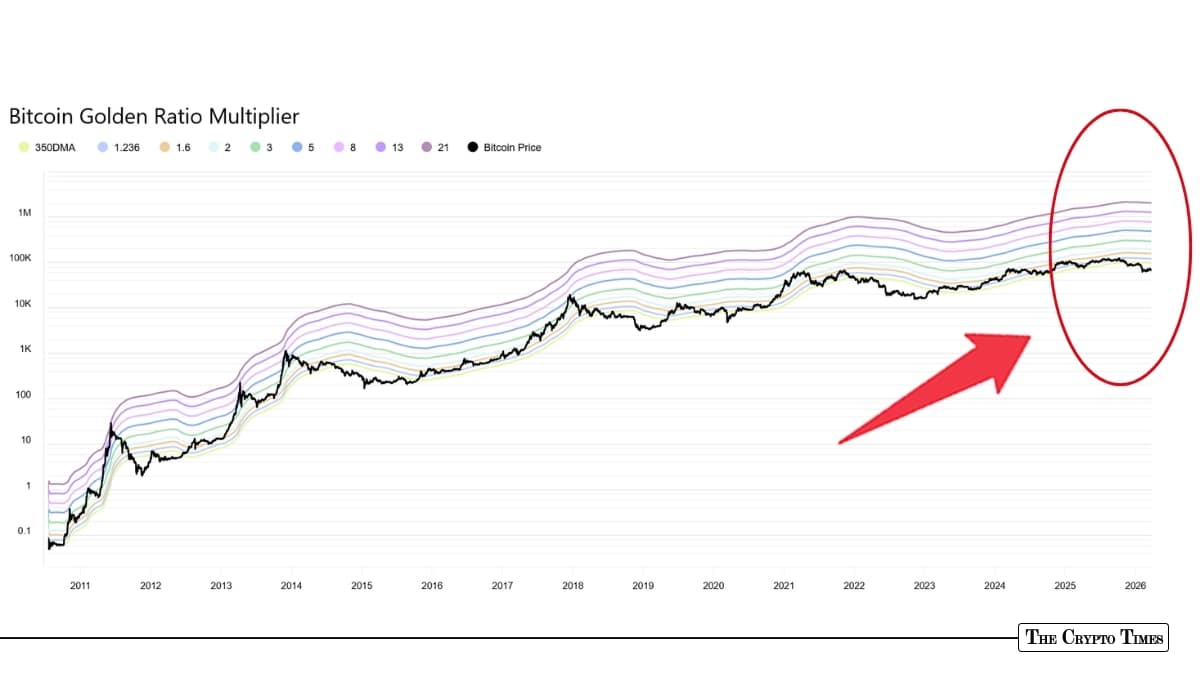
While Bitcoin is hovering around $71K, a far cry from the heady heights many expected after the last halving cycle. Yet one quiet corner of the charts is flashing a message of patience rather than panic: the Golden Ratio Multiplier, a long-term indicator tracked closely by analysts for its uncanny ability to map Bitcoin’s market cycles.
The tool starts with Bitcoin’s 350-day moving average, currently sitting at $98,453—and multiplies it by Fibonacci-derived ratios, including the famous golden ratio of roughly 1.618.
These bands have historically marked intracycle highs and, more importantly, the blow-off tops of previous bull runs. In 2011 the peak came near the 21x multiple. By 2013 it was closer to 13x. The 2017 top aligned with 5x, and the 2021 cycle crested just above 3x. Each time, the multiple required to reach euphoria has grown smaller as Bitcoin has matured.
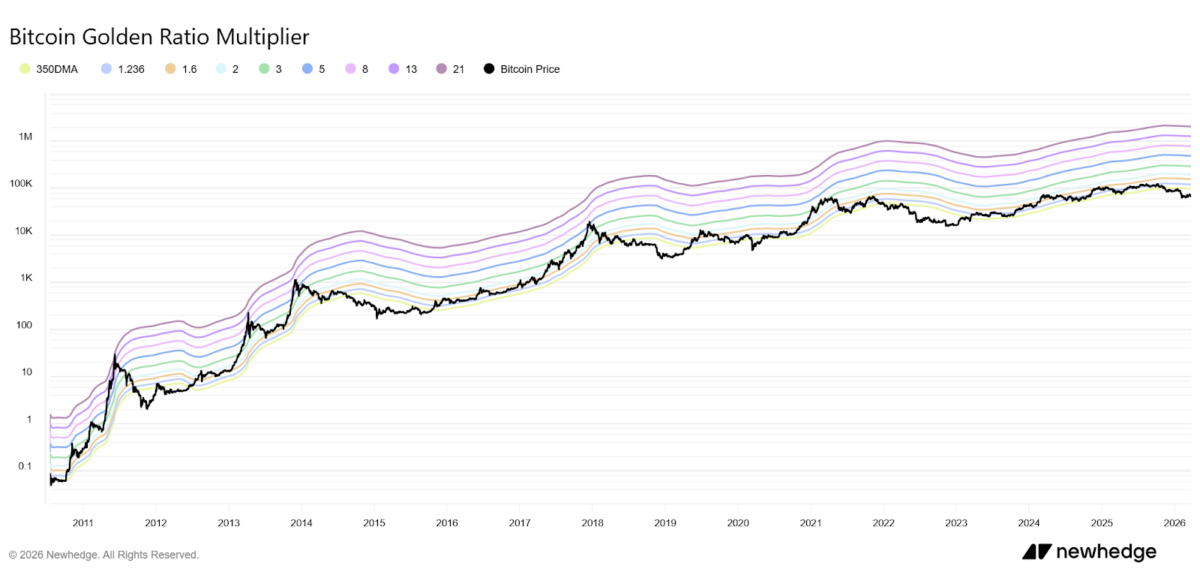
Today, the picture looks strikingly different. Bitcoin trades well below its 350-day average and has yet to test even the lowest meaningful resistance band at 1.236x, which stands at about $121,700.
The golden ratio line itself—1.6x—rests near $157,500, while the 2x band sits at roughly $197,000. The 24-hour change on the golden ratio band was a negligible -0.02%, underscoring how slowly these long-term levels move.
The long-term game in play
With the $100,000 psychological barrier now in the rear-view mirror, they suggest a new growth phase could be underway—one where traditional Fibonacci multiples give way to steadier, institution-driven appreciation.
Still, the math remains compelling for those watching the current cycle. If history’s pattern of declining multiples holds, many expect the next major top to form somewhere between the 1.6x and 2x levels—putting a realistic ceiling between $158,000 and $197,000 before any serious exhaustion sets in. Higher bands at 3x ($295,000) and beyond are viewed by most as stretch targets for a truly parabolic blow-off that may not materialize this time around.
Bitcoin currently trading at $71,150—as per CoinMarketCap data—with the 350-day average still well overhead, the indicator isn’t screaming to sell.
Although none of this guarantees a smooth ride. Macro headwinds, regulatory noise, and broader risk appetite will all play their part.
But for now, the Golden Ratio Multiplier is quietly telling a story of unfinished business: Bitcoin has room to run before it once again stares down the mathematical ceilings that have capped every prior bull market.
Also read: Bitcoin Hits Rare Two-Block Reorg: Foundry USA Mines Seven in a Row